Batch job dashboard tutorial
This tutorial is part of our Batch Job example
This tutorial will show an example of how to create a dashboard for tracking batches and property values within. This is part of our cookie production example .
Overview
This dashboard is used for production and quality control as it shows raw material information for each production batch. This monitor enables to track e.g. container temperatures and raw material amounts for each produced batch.
First we navigate to the dashboard editor. It can be reached at https://{your History url}/view. Open the Tree window and create a new dashboard to chosen folder. Then we will open the widget library and start adding our widgets to dashboard using the drag & drop mechanism.
Structure of the dashboard
Picture below shows our finished monitor and below is a list of all the widgets we used.
Widgets on batch job monitoring dashboard:
- Datalist and timebar: This datalist shows batch id's and start and end time of each batch. We attached time bar to our start time property so that datalist shows batches in chronological order over a one day period.
- Value bars: These are used to show raw material container temperatures.
- Value widgets and labels: Value widgets are used to show single property values. Labels on top indicate name of property value shown.
- Chart and ruler: The chart widget we use to show other key figures, e.g. total cookie bag number, total pallet number and pallet ids, total price. These are all per batch values. Ruler is used to give value scaling.
- Time bar: The second time bar (we will call this timebar2) above the chart is used for showing the production time of each batch. This requires some advanced setting that we will go through below.
- Labels: In addition we added a few labels to show title for each widget.
- Panels: Panels we use as backgrounds of widgets to divide the data for better readability.
Step-by-step guide
Time bar settings
First we make our timebar2 (time bar connected to chart) listen to our datalist widget. This can be done in time bar property settings Listen to Context . Next on our timebar2 settings we will further define Advanced settings as shown below.
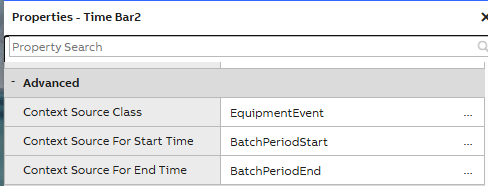
We have added there our source class (as explained in our batch example, we are writing some values to existing EquipmentEvent class that allows bigger logging tables) and period start and end times from that source.
Now our timebar2 will show start and end time of each production batch when one Cookie Batch Id is being selected from datalist.
Chart settings
Next we will make our chart widget listen to our timebar2. This can be done similarly in property settings Listen to Context. With this the data in our chart widget will update according to the time period shown in timebar2.
Value bar and Value widget settings
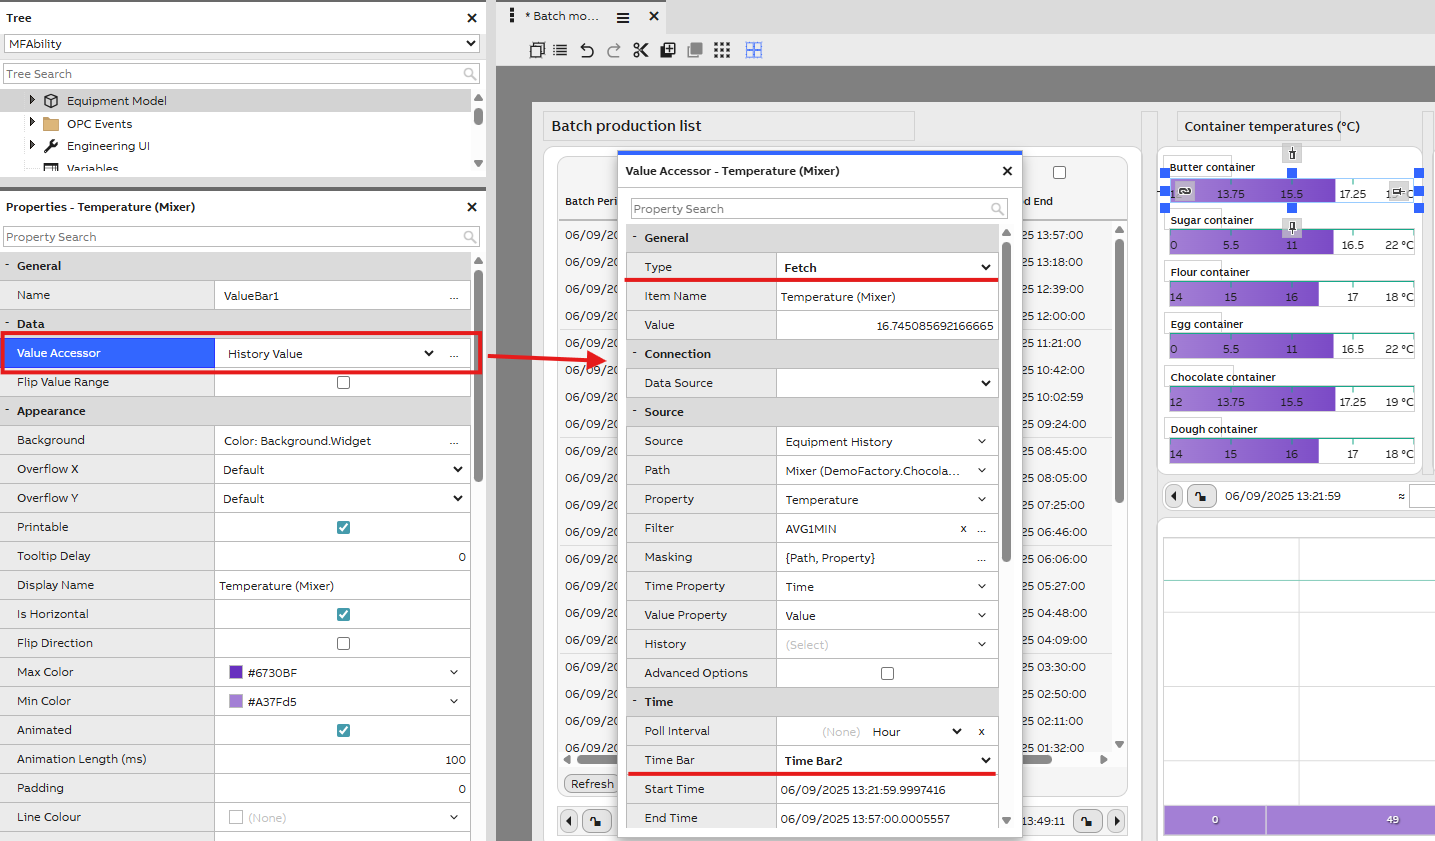
To make our value bars and value widgets listen to batch id changes, we need to configure settings slightly differently. We can open one widget property settings and search for Value Accessor property. For this we select History Value. Now, from the three dots beside this we open further settings and for Type property we choose fetch. This is used when history values are being fetched from database. If we choose subscription here, the widget will not show value as intended. Then for Time Bar property we select our timebar2.
As for other setting, we have chosen our properties for each widget as needed. We could either drag &drop these on the widget and finish the common settings or insert each information manually.
An example of these settings is shown below.
Repeat these steps for all value and value bar widgets needed.
Save and test
After all settings are done, we can save dashboard settings, close the edit mode and test that everything works. In our case, we choose one Cookie Batch Id from our datalist and now the data in our timebar2, chart and other widgets should change accordingly.
Updated 4 months ago