OData Problem solving examples
This tutorial will list some issues and their solutions.
Getting started with OData in Excel
Structural data
To read Equipment Models of structural data with Excel is simple with few steps.
- Open Excel -> Data -> Get data -> From other data source -> From OData feed.
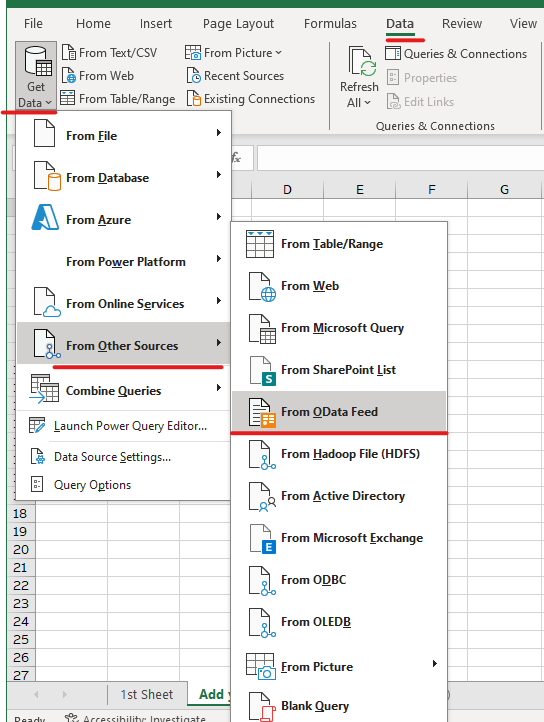
Starting with Excel OData feed
- Now on the pop-up window you need to give a URL . You need to know where you are connecting to so this URL will include the connection string and /odata in the end.
- After providing the correct URL a new pop-up window opens, where you can see a list of all the entities available through OData connection. We kindly remind that only classes with name or id are visible here.
- As you choose your Equipment Model and load the data, Excel opens the Equipment Model with properties to a new excel sheet.
- Now if you want to modify the query (to select a different class for example), move you mouse over the equipment model on the right side of the sheet and choose edit.
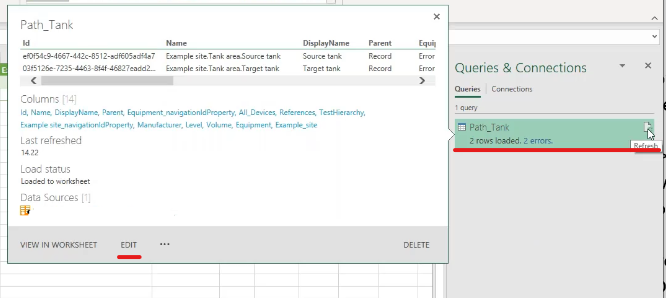
Editing chosen Equipment Model
- Now you can choose a new Equipment Model from the navigation settings shown on the right side (wheel -symbol on the right side of navigation). However, if you want to make a query for multiple classes, you can easily copy+paste the first Equipment Model and then choose edit and select a new class under the navigation settings.
Please note:
- No server side filtering is possible with excel, but excel provides and Advanced Editor that uses Microsoft Power Query language, where queries may be specified. This is not completely OData compatible.
- With ABB Ability™ History, OData System query options allow us to use Vtrin filters on server side and combine those by using and and or specifications.
- Easy way to connect and try OData system query options would be with Chrome. We have gathered some examples under OData Example requests.
Simple OData query in Excel: Time series data
When fetching time series data and doing any OData functions in Excel, we use the advanced editor that uses power query language. Advanced editor may be found by opening the power query editor, creating a new blank query. Now right click on the Queries list shown on the left and from opening menu choose advance editor.
The picture below shows an example of a time series fetch query.
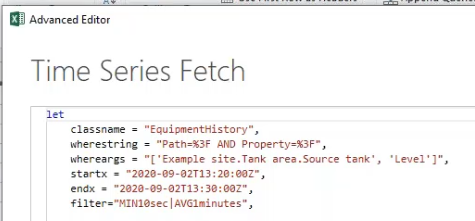
Example of parameters in time series fetch
Parameters of fetch query:
- classname: When reading data from Equipment Model, the classname is EquipmentHistory. When reading data from variables, the classname is ProcessHistory.
- wherestring : Defines what we want to read. In our example query, this includes equipment model and property.
- whereargs: Here we give the Equipment Model path and property name. Remember to include square brackets when needed.
- startx and endx: Here we may define the start and end time of our query. Start time is optional, end time is required. When we give end time only, the data will be returned in reverse order starting from newest one.
- filter: This means the available Vtrin filters we have for our ABB Ability™ History. The available filters may be found under processing data - filters. If we leave this empty, we can fetch raw data without filtering.
Power Query issues (Excel and Power BI) with array parameters
Power query, that is used by Excel and Power Bi, do have some issues when it comes to array parameters in functions. This is what we use when fetching historical data, so we have come up with a workaround.
Open Power Query Editor and create a new blank query. Now on the left you can see "Queries" list. Right click on top of the queries list and from opening menu choose "advance editor". There you can paste the code that is shown below. Define the parameters as you need and then select Done.

Advanced editor menu
Workaround code
let
    classname = "EquipmentHistory",
    wherestring = "Path=%3F AND Property=%3F",
    whereargs = "['ABB.System Monitoring.ROOPE', 'DISK_Load']",
    startx = "2019-05-09T12:20:00Z",
    endx = "2019-05-09T13:30:00Z",
    /* Edit the values above and press Done */

    fetchResult = OData.Feed("localhost/odata/FetchGraphData(classname='" & classname & "', wherestring='" & wherestring & "', whereargs=" & whereargs  & ", startx='" & startx & "', endx='" & endx & "')", null),
    result = fetchResult{0}
in
    result
The result is three rows which each has a list. This can be turned into a nice table with few simple steps:
- First, convert the result into a table.
- Transform each list into a string value with each value separated by semicolon ( ; ).
- Split the string value from step 2 on semicolon ( ; ) and put each result in a new column. After this step you have a table with three rows and a lot of column.
- Flip columns and rows by pressing transpose.
Below is an example script when this is done.
let
    /* … above script is here */

    /* Below rows are used to turn the data into a table */
    #"Converted to Table" = Record.ToTable(result),
    #"Extracted Values" = Table.TransformColumns(#"Converted to Table", {"Value", each Text.Combine(List.Transform(_, Text.From), ";"), type text}),
    #"Split Column by Delimiter" = Table.SplitColumn(#"Extracted Values", "Value", Splitter.SplitTextByDelimiter(";", QuoteStyle.Csv), {"Value.1", "Value.2", "Value.3", "Value.4", "Value.5", "Value.6", "Value.7", "Value.8", "Value.9", "Value.10", "Value.11", "Value.12", "Value.13", "Value.14", "Value.15", "Value.16", "Value.17", "Value.18", "Value.19", "Value.20", "Value.21", "Value.22", "Value.23", "Value.24", "Value.25", "Value.26", "Value.27", "Value.28", "Value.29", "Value.30", "Value.31", "Value.32", "Value.33", "Value.34", "Value.35", "Value.36", "Value.37", "Value.38", "Value.39"}),
    #"Transposed Table" = Table.Transpose(#"Split Column by Delimiter")
in
    #"Transposed Table"
Issue with Power BI OData feed
In some cases, invoking OData requests with Power BI to publish reports to the Power BI cloud will not work. This can be solved by using Web.Contents() instead of ODATA.Feed() function, like so:
// result = OData.Feed(fullURL, null, [Implementation="2.0"]),
source = Web.Contents(address, [ RelativePath = path ]),
json = Json.Document(source),
Change Log
Performance Improvement: Utilize Filter-query in Backend
(Starting RTDB 5.3_23.04 version, 5th of April 2023)
Previously, when issued a GET-request with filter-query, all instances were fetched from backend and filtering done afterwards. Now, filter-query will be translated to a Vtrin mask and passed on to backend. With this, users are less likely to get exceptions, if fetching too many instances.
Below we give some examples which filter-queries can be translated to Vtrin mask:
- People?$filter=Name eq 'Milk'
- People?$filter=LifeTime gt 1 and LifeTime lt 20
- People?$filter=not (Age eq 50)
- People?$filter=100 le LifeTime
- People?$filter=FirstName eq 'Mike' or ID le 500
- People?$filter=startswith(Name, 'Mi')
- People?$filter=endswith(Name, 'ke')
- People?$filter=contains(Name, 'ik')
If filter-query contains expression which are not translatable to Vtrin mask, it will be removed from preprocessing (pre-filtering), but will be postprocessed if possible. For example:
- People?$filter=length(Name) eq 1
- People?$filter=trim(Name) eq 'Mike'
- People?$filter=ceiling(ID) eq 1
- People?$filter=startswith('Mi', Name)
- People?$filter=ID add 1 eq 10
- People?$filter=indexof(Name,'Mike') eq 1
Updated 9 months ago