Diagnostics
Unfortunately (or luckily), the information useful for understanding the behavior of the system cannot be found in just one place. Often, the administrator should at least understand which component is responsible for some functionality, to be able to find what tools are available for understanding the behavior in detail. To learn which component does what, the article Services contains valuable information. Those who are not that familiar with RTDB yet should at least read the descriptions of each service to understand what they do.
This section covers the description of the available diagnostics tools in general. In the article Services, this information is referred to in a section that covers the diagnostics and troubleshooting of each service.
Component status
A good place to start monitoring the condition of the system is Component status. ComponentStatus is available for browsing from Engineering UI in "Diagnostics" > "Component Status".
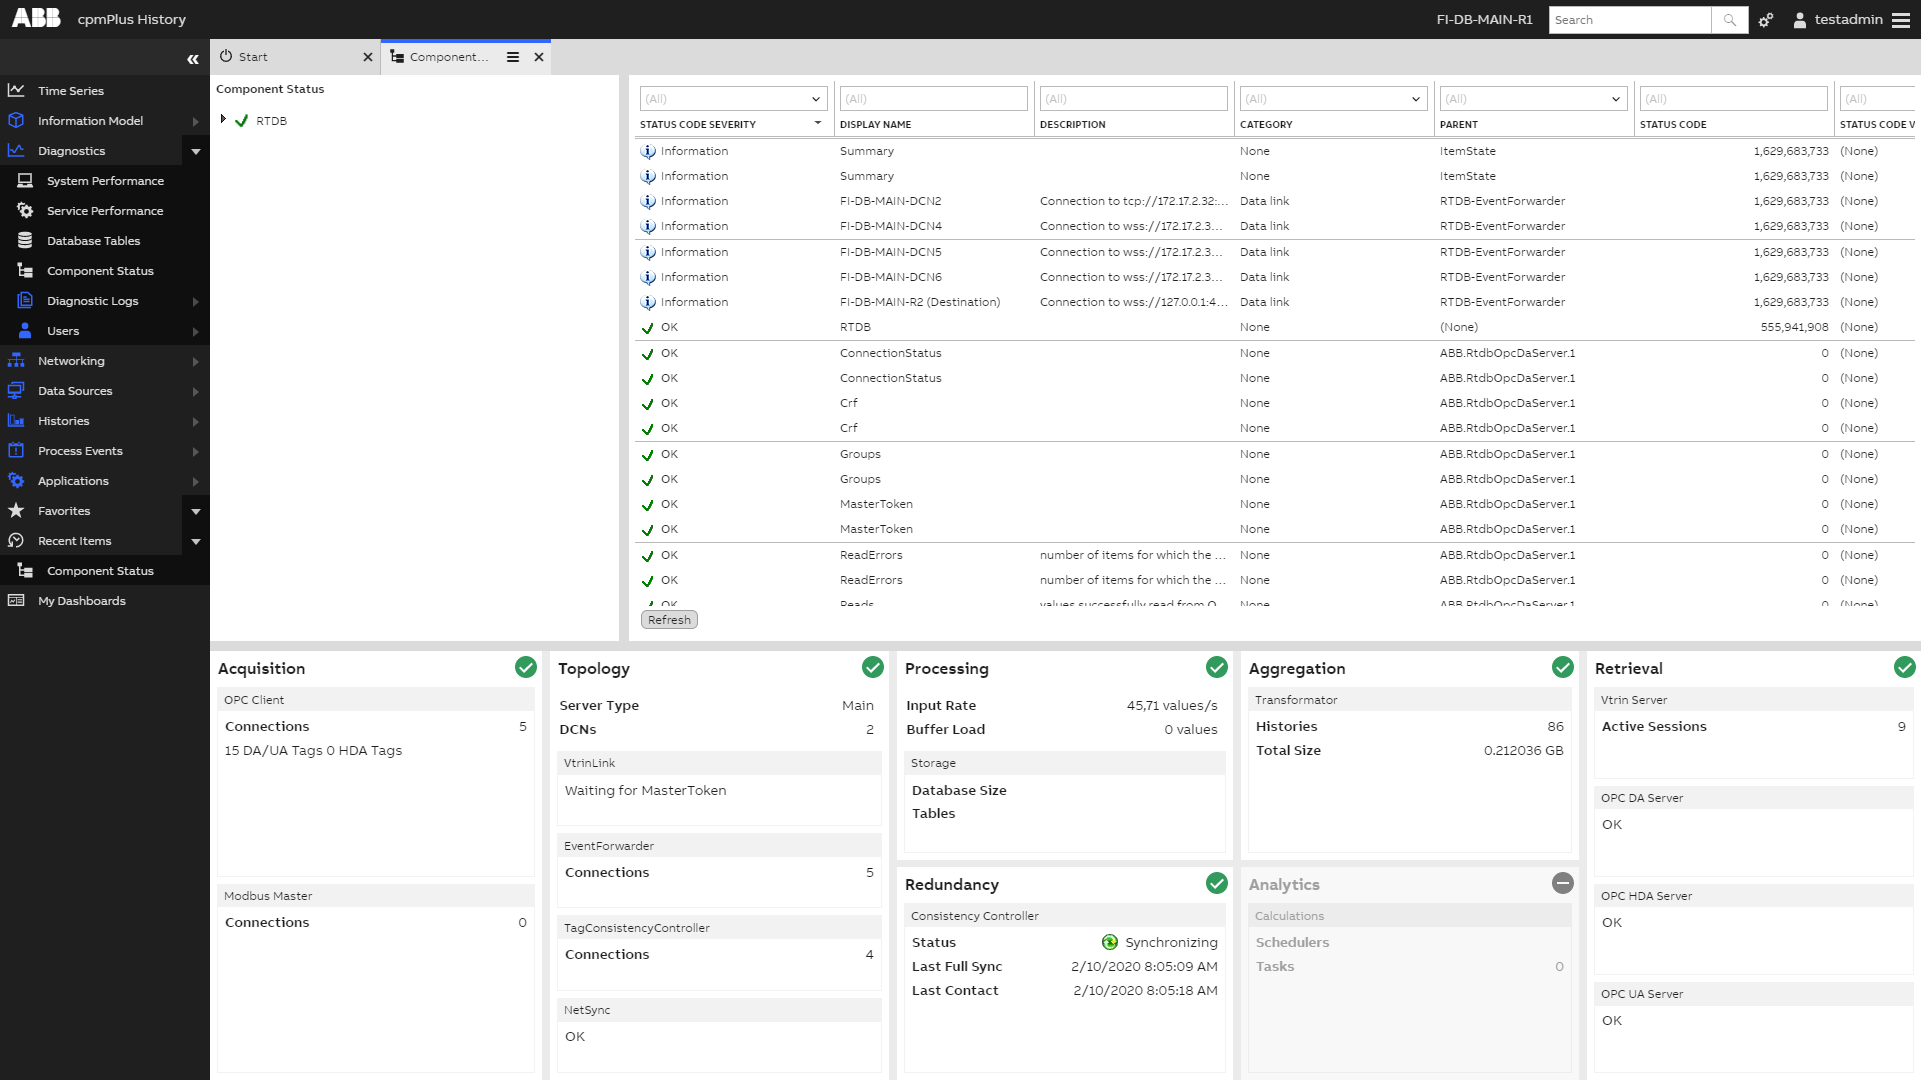
Component status has a parent-child relationship. One component status has zero or more children and one parent, except in the root level there is always a node ‘RTDB’ that has no parent.
The generic properties window (by default docked below the tree component) is used to show the status information related to each component. The status code shows the integer presentation for the status. Based on this information, the icons visible to the user are interpreted. The currently used status codes are: OK, Information, Warning and Error (in increasing severity order).
| OK |
| Information |
| Warning |
| Error |


Component status information is updated by the owner component. E.g. the VtrinLink component status and the related children are updated by the VtrinLink service, and RTDB-TagConsistencyController components are updated by the RTDB-TagConsistencyController service. The first three levels in redundant MAIN nodes, and the first two levels in normal MAIN nodes and data collectors, are updated by the RTDB service manager service (RTDB\FI4-MAIN1\RTDB). It is up to each component to decide how it propagates the component status information from the child node to the parent node. In case of errors that are important to be resolved, they would be visible in the root level as Error. In that case, the administrator should browse from the root level down to those components that are showing errors, and resolve the problem. A hint on what is going on can be found either from the StatusCode or StatusText properties. In addition, one useful thing to do is to read the documentation of an error generating service from the article Services. All services are not yet covered by component status, but the number of components supporting it will increase in future releases. This makes the component status a good place to start when troubleshooting. Details of the information available for different components can be found from the article Services.
MessageLog
Many services provide tracing information to MessageLog. It is available from the Engineering UI in "Diagnostics" > "Diagnostic Logs" > "Service Messages".
 (2).png")
Message log is displaying information from RTDB-CVMCServer service.
These messages can be monitored in the MessageLog display. The MessageLog display is operated like any list display in Vtrin. Useful filters are at least ‘EventTime’ and ‘ProcessName’. Services that produce logging information to message log are the RTDB main service (SRVMGR in ‘ProcessName’), RTDB-CVMCServer, RTDB-Transformator, RTDB-EcPerfmon and RTDB-EcOpcClient.
Messages in MessageLog can be fetched and monitored also with the RTDB_MsgType tool. This tool can also be used remotely because it uses the ODBC connection to the database. The tool can be used to inspect old diagnostic messages and to continuously monitor new messages. The actual diagnostic messages are stored in the RTDB table named MessageLog (Vtrin class MessageLog).
One important trick to remember from the MessageLog mechanism is that it is a ‘filtering log’. Forgetting this has caused confusion even for the most experienced RTDB specialists. The filtering mechanism means that similar event messages are filtered out from the log table and only a filter count is incremented, which leaves some information behind that there have been additional similar messages. The ‘similarity’ of the diagnostic messages does not mean that the messages must be ‘identical’, instead the following heuristics is used: the messages are treated similar if they differ only on numbers, except if the number is after a letter (however, some RTDB applications may override the definition of similarity). For example, the messages “PM1_SPEED=9.9” and “PM1_SPEED=10.1” are treated similar but “PM1_SPEED=9.9” and “PM2_SPEED=9.9” are treated different, while “PM11_SPEED=9.9” and “PM12_SPEED=9.9” are again treated similar. The similarity is handled within the name of the application (or process ) that produces the message, so the messages “hello” and “hello” are treated different if they come from different applications (again, some applications may override the definition of similarity). The similarity check is performed within an 8-hour time window (can be set in SimpleConfig). The time window starts when the first message (of a kind) arrives. The MessageLog table remembers the first time and last time when the message has arrived. Together with the filter count, the information is often enough to be useful for determining what has happened and when.
To display MessageLog messages using the MsgType application:
- Log in to the active node.
- Open the ‘Diagnostics Tools’ from the RTDB control panel (from the installer user’s desktop or from
%APP_DATAPATH%\RTDB Control Panel). - Run any of the prepared
MsgType - *commands, for exampleMsgType - Service Manager, which prints the old messages within the last 10 hours, and keeps monitoring new messages (note that the amount of old messages printed varies between each tool, and for most tools the setting is 10 minutes). - The
MsgType - Askis the interactive version. It asks the process name (or part of it), a search string, and how old messages are printed (as seconds). - The
MsgType - Askcan also be used in a more advanced way: to the questionGive delta seconds [600]:you can answer:600 -c 1fto also display the first time when the message occurred. The available letters that can be used are: p=ProcessName, 1=FirstTime, f=Filterings, s=Severity. Severity number: 0 = success, 1 = info, 2 = warning, 3 = error600 -i 0.5to use a 0.5 second polling interval for the messages instead of the default of 3
More help can be found by running the following from command line: RTDB_MsgType -?
Diagnostic log files
Most RTDB services produce diagnostics logs in text files that reside in the Diag subdirectory under the database path:
%APP_DATAPATH>\Diag(e.g. D:\RTDBData\Diag).
The name of the diagnostic text file begins with the service name, except that the special characters in the service name are substituted, for example:
RTDB-EcOpcClient D RTDBData.logUsually, a new log file is generated for every day, and when the number of log files exceeds the predefined limit, cleaning is done starting from the oldest.
Diagnostic files can be opened with any suitable tool, e.g. Notepad.
If there are dedicated behavior or tools for diagnostics, these are documented in Services. For clarity, some services use a dedicated folder under the folder %APP_DATAPATH%\Diag to store logging information. Such services are RTDB-CalcScheduler, RTDB-EventForwarder, RTDB-TagConsistencyController, RTDB-OpcDaServer, RTDB-OpcHdaServer, CpmPlusKM-OpcDaServer and CpmPlusKM-OpcHdaServer.
Windows performance counters
A useful tool for understanding the behavior of the system is to monitor Windows performance counters. There are system-wide performance counters for various resources, as well as counters for specific processes. Monitoring the history of RTDB-related performance counters has been made very easy, as a selected set of performance counters has been configured to be collected after setup. The following image illustrates some of the performance counters available.
 (1).png")
Windows performance counters are found after installation from the Variables list. To display only performance counters, the "sys*" filter can be applied to the "Name" property.
Depending on the configuration, some performance counters are not collecting data. These are marked with a red exclamation mark icon. The history of a variable is found easiest from the context menu of the variable instance by selecting "Send to" > "Trend". The performance data is collected from Windows performance counters by the service RTDB-EcPerfMon. If some important counters are missing, adding new ones is done by adding new rows to the eccrossrefs table using the ODBC interface.
Windows Event log
The RTDB services and software libraries may write messages to the Windows Event Log in situations where the other diagnostic means are not possible (for example, when the MessageLog table of the RTDB database is missing or corrupted, or the given RTDB data path was incorrect). In addition, Windows does useful logging in case of application crashes.
Windows Event Viewer is started from the Windows start menu ‘All Programs\Administrative Tools\Event Viewer’. Windows Administrative rights are needed. The messages from RTDB or messages from application crashes are available in the folder Windows Logs in the list ‘Application’.
Windows Task Manager and Resource Monitor
Windows task manager is a useful tool for any RTDB administrator. Quickly taking a look at the process list (sort by image name) shows a lot about the system to the administrator, at least when enough columns have been selected to be visible (from main menu "View" > "Select Columns"). "Show process from all users" should be selected, as otherwise all RTDB processes are not visible (depending on the user).

Windows Task Manager is showing multiple RTDB processes. Some RTDB-related processes, where the name starts with ‘Vtrin’, are not visible in this picture. Some of the processes are running under the system account, as others are running using the admin user credentials.
A quite useful tool available in Windows Server 2008, Windows Server 2008 R2 and Windows 7 is ‘Resource Monitor’ (here a version from Windows Server 2008 R2 is used). Especially the version available in 2008 R2 is nice, as it contains an easy-to-use tool for monitoring disk activity file-by-file for each process. Resource Monitor is started e.g. from the Task Manager ‘Performance’ tab from the button ‘Resource Monitor’ (Figure 6.10).

Windows Task Manager shows the performance overview of the computer. Resource Monitor is started from the button ‘ResourceMonitor…’.
There are many useful features and separate diagnostics for ‘Overview of the performance’, ‘CPU’, ‘Memory’, ‘Disk I/O’ and ‘Networking’ behind the five tabs. As Disk I/O usually is the first bottleneck in this kind of database product, a very nice feature is the ability to monitor in detail which processes are consuming the most I/O time, and what tables are causing the load.

Windows resource monitor showing the disk activity of the "RTDB_ConsistencyController" process in High Availability RTDB main node. The ‘File’ column of the ‘Disk Activity’ section is showing the database tables the I/O access is directed to.
SysInternal's Process Explorer
Process Explorer (procexp.exe), originally written by Mark Russinovich, and nowadays a free Microsoft product, is a powerful tool to monitor processes in a system. Process Explorer can be used e.g. to verify what dlls some process has loaded (From main menu ‘View\Show Lower Pane’ and ‘View\Show Lower Pane View\DLLs’ should be selected). Another common use case is to show the handles that the process owns (from main menu ‘View\Show Lower Pane’ and ‘View\Show Lower Pane View\Handles’ should be selected).
Searches can be done to find if a particular dll or handle is owned by any process (from main menu ‘Find\Find Handle or DLL’). This is a particularly nice feature e.g. to ensure that any application program is not keeping some dlls loaded when they should not do that (e.g. when upgrading RTDB). An experienced user can also use the Handle search to troubleshoot locking problems.
Updated 9 months ago