Debugging application
Debugging View application on a web browser
Introduction
View is primarily written in Javascript. Some parts of it have been converted to Typescript. Debugging View is done using web browser’s built in Debugger. In our case the browser in use is Google Chrome.
Open the debugger
Once View is running on your web browser, right click on a non-context sensitive area and you will be presented the browser’s context menu. Click on the last option Inspect,
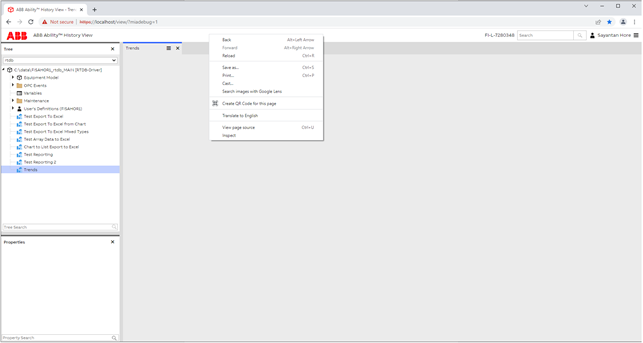
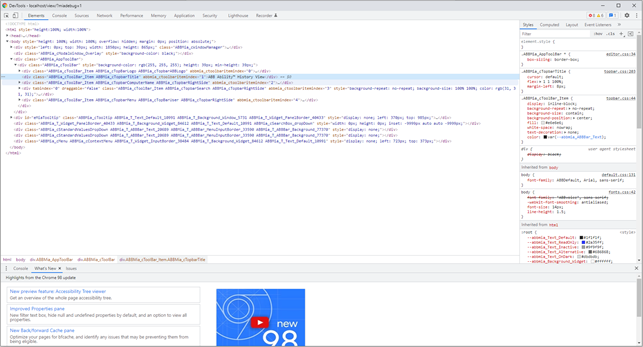
... and the debugger window will appear as below.
Note: View can have widgets on it which are context sensitive. Right clicking on such a widget will reveal View’s own context menu.
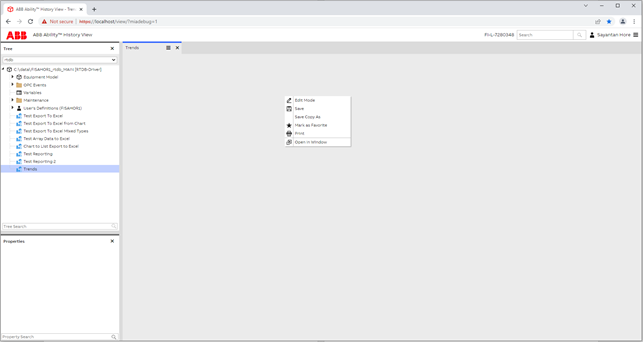
In that case right click on a non-context sensitive area. Typically, the application header (a narrow horizontal strip after the application’s display name is an area where there is no application context attached.

Notice the Menu at the top of the debugger window just opened.

Most often we need Elements, Console and Sources. We also need Network and Performance sometimes. For the initial part of this tutorial, we will focus on Elements, Console and Sources. The leftmost arrow pointing UP-LEFT towards inside a square enclosure is also something we need often.
Console
We use the browser’s console to display log, warning and error output we put in our code, console.log, console.warn and console.error respectively. Logging in the console is a way to know the path in the code a certain flow is traversing. But it is a lot of work to put and remove console.log in a lot of places. Therefore, this approach won’t be handy for a long debugging session.
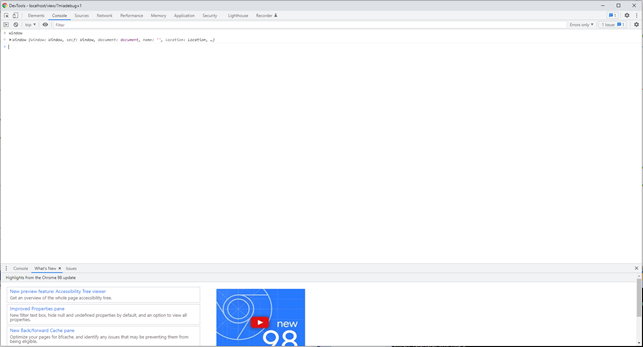
The View application has two debug modes, referred to as miadebug=1 and miadebug=2. The later one splits out more log on the console. Here we are dealing with logs not only from the code you have written but the application in general, its loading, database connection, websocket connection to the backend etc. Use miadebug=1 in case you don’t want to load your console with log information you don’t want to see. You can use any of these modes in the url as shown below.
https://localhost/view/?miadebug=1
or
https://localhost/view/?miadebug=2
Sources
The source files of currently executing code can be loaded under Sources tab. Here we can see if the latest code has been picked up by the browser and moreover, we can attach breakpoints to lines of code we want to investigate. State of variables in the scope, where breakpoints are placed, are shown and we don’t need to log those variables explicitly. Breakpoints can be switched on and off simply by checking or unchecking the checkboxes and they can be removed at once after the debugging is over.
With proper mapping in place even Typescript source files can be loaded into the debugger.
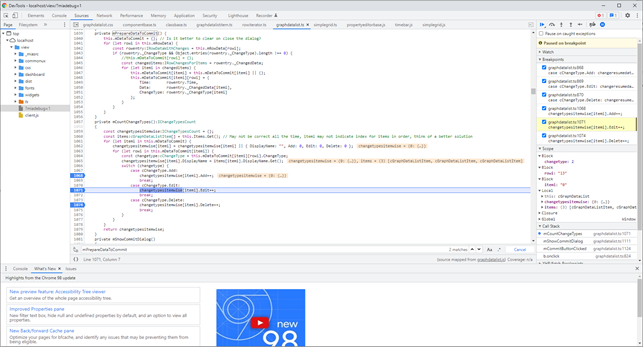
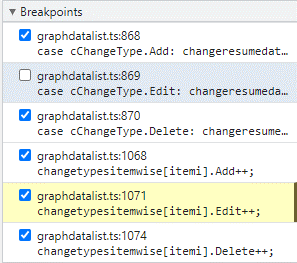
The breakpoint window highlights where the code is waiting now. Some breakpoints can be ticked off and they won’t stop the flow.
There are navigation controls to walk through the breakpoints. When you are at a breakpoint that calls a function, you can Step Into the function without having an explicit breakpoint inside that function etc. For more information see Chrome’s documentation.

Elements
When you want to investigate a DOM Element on the running application you click on the arrow pointing UP-LEFT we mentioned earlier, and the arrow will turn blue in colour.
Now mouseover the DOM element you want to investigate on the running application. You will see the element getting highlighted.
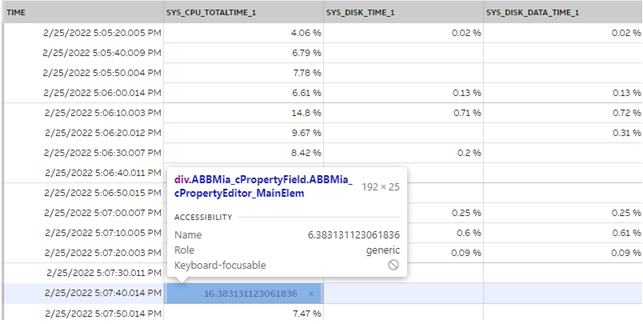
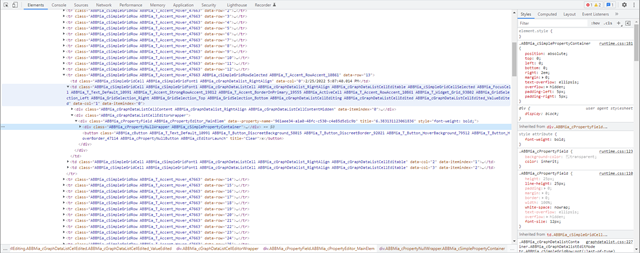
After you click on it the elements will be shown in the rendered DOM tree under the Elements tab on the debugger. There you can investigate the attributes the element is loaded with along with the stylesheet hierarchy. You can tweak the styles and attribute values and see the effects there.
Updated 9 months ago
