Aggregated histories
The following sections describe what kind of mechanisms there are for configuring how numerical process data is stored into process history tables. Although the configuration is very easy through the Tag interface class, it is good to understand some details as well, especially in situations where the default configuration does not meet the requirements well enough.
Related classes
The figure below illustrates the classes related to history configuration. The details of the Tag and Variable classes have been presented in previous articles. To summarize, the Tag class is an interface class that is used to configure the database. Instances of the Variable and TransformationEngineering classes are created automatically when the Tag instance is created, and the lifetime is bound to the lifetime of the Tag instance (composition).
The HistoryCollectionTemplate class defines what kind of secondary logs are collected for each tag. By default, there are history collection templates defined for:
- Average (
AVG) - Sum of Values (
SUM) - Minimum (
MIN) - Maximum (
MAX) - Deviation (
DEV) - First Value (
FVA) - Last Value (
LVA) - Operating Time (
OPT) - Startup Count (
CNT) - Forecast Averages (
FOR)
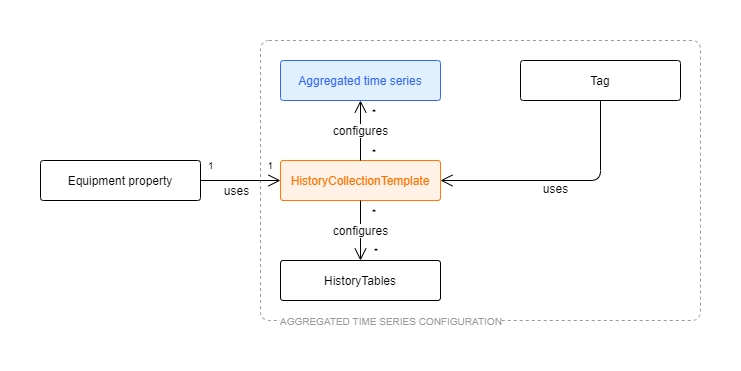
Figure 1. Relationships between classes that define how numerical data is historized into actual database tables.
The property HistoryCollectionTemplates from the Tag class is used to configure which (0 to N) history collection templates are applied, i.e. defined to be collected, when the tag begins to receive values from an external data source.
Each history collection template defines the chain of histories using the property Template. The default templates consist of three periods: 1 minute, 1 hour and 1 day. The 1-minute history is collected from raw history (Current history), 1-hour history is collected from 1-minute history, and 1-day history is collected from 1-hour history.
Finally, the History class defines what kind of physical history tables there are available in the database. These histories are referred from the HistoryCollectionTemplate class by Name. Each history definition defines exactly how data is collected. More detailed information about the HistoryCollectionTemplate and History classes is available in the following sections.
The OPT and CNT histories needs definitions in the Variables table in order to define the operating state (StatisticsLimitFunction and StatisticsReferenceValue). (The OPT and CNT aggregates are available only for Variables, not for historized properties of equipments).
Aggregated Time Series ConfigurationFurther information on Aggregated time series configuration and HistoryCollectionTemplate class through link: Aggregated Time Series Configuration
Using History collection templates
The History collection templates list is found from Engineering UI under Histories\Aggregation Templates. There are also displays for History Tables (History class) and History Collections (Transformation Engineering class).
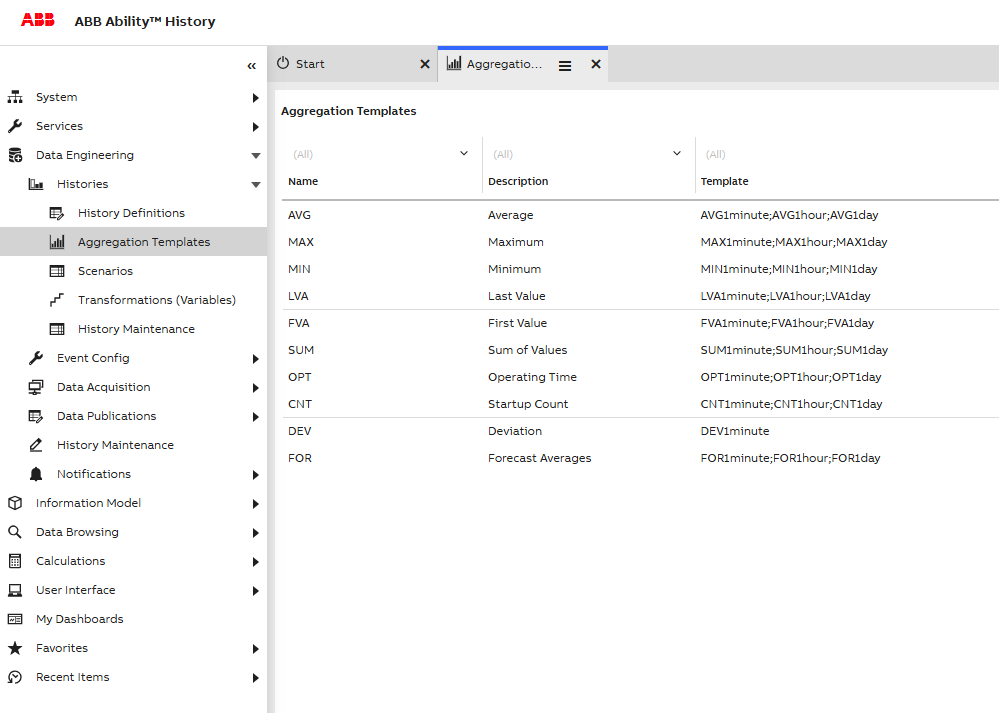
Figure 2. History collection templates that are available by default after installation.
New history collection templates can be created using Engineering UI, if those available by default do not meet all the requirements. When new history collection templates are created, each one is identified uniquely using Id (GUID) (not visible by default in list view and automatically generated). The Name of the template is unique as well. The content of the Template property is a semicolon-separated list of histories that are collected when the history collection template is applied to the tag instance. The list of available histories is available in the display ‘History tables’. Another important thing to ensure is that the chain of histories is able to produce data, i.e. the chain is such that each source table is available in the chain (check the SourceTable property in the ‘History Tables’ list). An example of a non-working chain would be the ‘AVG_BAD’ template, where the Template chain would be ‘AVG1minute;AVG1day’. Looking from the ‘History Tables’ list, it is obvious that ‘AVG1day’ is collected from the ‘AVG1hour’ table, which is not included in the chain.
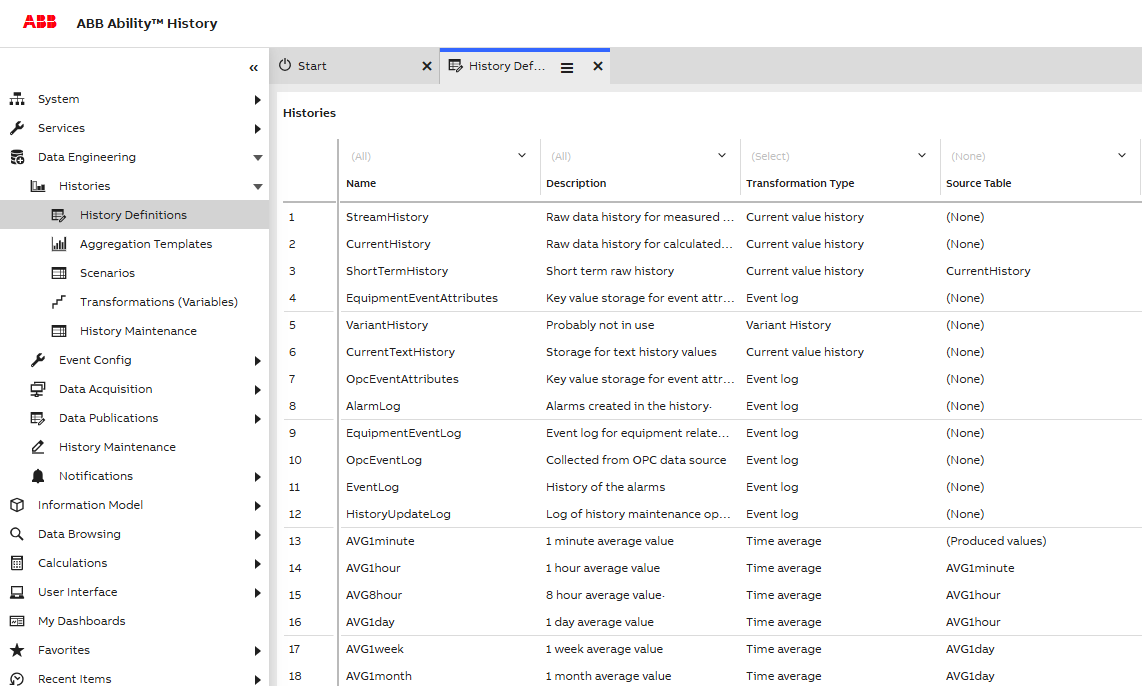
Figure 3. History tables available. Selected histories are used in the history collection template AVG. In each history table, it is defined where the data is collected from. E.g. the AVG1minute table is collected from CurrentHistory, and AVG1hour is collected from AVG1minute.
If new history collection templates are created in a hierarchical system, same templates should be created in each data collector node and main node(s). This is important especially from a System 800xA integration perspective. The 800xA interface should be aware of the available template to be able to provide the 800xA administrator to use those, and also to be able to show historical data correctly e.g. in 800xA trend displays.
When history collection templates are applied to the Tag instance, it is good to know that secondary histories are only collected in the main node in a hierarchical system. As the purpose of the data collector is mainly to buffer data, it does not make much sense to collect secondary logs twice (or even more times in case of a redundant data collector or a redundant high availability main server). Whether or not the secondary logs are collected is defined in DataBaseNode instances using the property ‘CollectSecondaryLogs’. By default, this is set to true only for MAIN nodes (a list of Database Nodes is available from Engineering UI in Networking\Database Nodes).
As a result of applying History collection templates into the tag, so-called transformations are created for the associated variable. These are available from Engineering UI in Histories\Aggregation Templates.
History tables configuration - the base for all history storing
This section describes the features and properties available in the History class (‘History tables’ list). In most cases, the changes to history tables are not needed, but it is anyway valuable to understand the details and how they affect the history collection process.
Some of the properties of the History tables were already discussed in the previous section and in Figure 3. There are quite many properties available, and thus using the default list view is not always convenient. Instead, one can use the default properties window (Figure 4). If it is not already visible, you can enable it from the menu by clicking on the icon at the top-right and then Window > Properties.
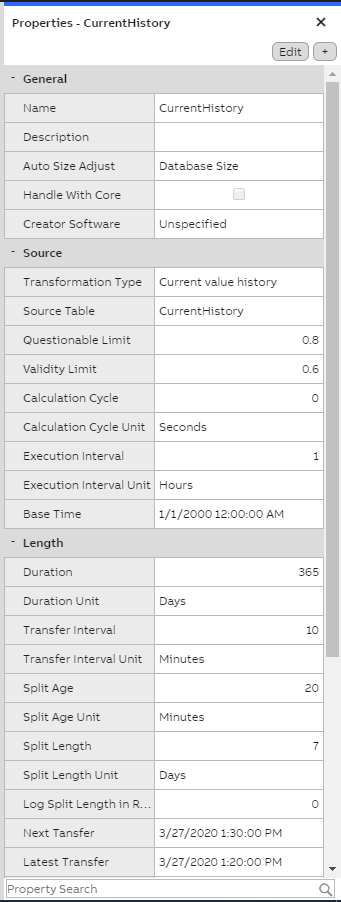
Figure 4. Properties of current history of the Data collector node.
Current History Data Collector node
General
- **Name:**The first property of the source tab is the name of the history table. ‘CurrentHistory’ is the most fundamental numerical history table, and usually all other numerical histories are collected originally from current history. (Note that this is not necessarily true if the original data provider inserts data directly to the upper-level history tables. This might be the case e.g. when RTDB C# calculations are used.) Another name for current history that is sometimes used is ‘Raw history’. ‘Current history’ might be a better name, because many times some processing, like compression, has already been applied to current history data depending on the configuration.
- Auto Size Adjust & Max size in Gigabytes: These control the size of the tables. The ‘Auto Size Adjust’ parameter controls the type of calculation that the history clean-up is based on. If the value is ‘Table size’, the cleaning decision is made based on data in this table only. In this case, the ‘Max Size in Gigabytes’ determines when the cleaning begins. As a result, the data is gradually cleaned up until the desired size is reached. If the maximum size is set to zero, there is no size limitation in use. By default, the ‘Auto Size Adjust’ is set to ‘Database Size’, and in this case the ‘Max Size in Gigabytes’ is not interpreted (and is set to 0). This leads to a cleaning strategy where the total amount of disk space available is controlling the cleaning. In the installation phase, it has been defined how large a percentage of the available disk space History is allowed to consume. This information is then automatically used to adjust the history lengths and control the cleaning.
Source
- Transformation Type:‘Transformation Type’ defines what kind of data is stored. Again Current history is a special case and data is defined to be ‘Current value history’.
- Source Table: The ‘Source Table’ defines where data is collected from to this history table. Current history is a special case and the source has been defined to be itself.
- Questionable Limit:‘Questionable Limit’ and ‘Validity Limit’ define how the status of data is marked in respect to the original data, when data is processed to this history level from the source table.
- Calculation Cycle:‘Calculation Cycle’ and ‘Execution Interval’ define when the aggregation is running.
- Base Time:‘Base Time’ defines how data is aligned in respect to time. The base time that is used by default is selected to be 1st of January 2300, as this time has quite many good characteristics.
Length
- Duration: ‘Duration’ controls the extent of the history based on time. Older data than this will be removed from the database. It is up to the RTDB-Transformator service to clean up history data that is too old. As can be seen from Figure 4, the length of the current history in the data collector is only 8 days. Please note: In the main node, the length of current history would be one year, by default.
- Splitting: ‘Splitting’ is an optimization and implementation-level concept available in History. Table can be either ‘split’ or ‘non-split’. All numerical history tables are split by default, as the expected amount of data is relatively large. Besides this, all event history and many log tables are split as well. Splitting means that logically one database table is divided into several smaller tables based on time. This enhances the performance and makes many internal implementation techniques possible.
- **Split Length:**If the ‘Storing as separate split tables’ is checked, the ‘Split length’ (with a unit definition) defines how long the splits are. Naturally, the split length should be smaller than the initial duration of the history. The split length is not, however, adjustable when the database is running. Also, it should be quite carefully analyzed when the split size should be changed. In practice, it is very rare that the administrator of the system would be required to change the splitting settings. A scenario where this might be needed would be such that the amount of input data would be drastically increasing from the original plans and requirements. In this case, decreasing the split size might result in better performance. However, reducing the split size might hide parts of the data that already exist in the database. This is why the default split size settings are selected to be such that the resulting split tables are still of acceptable size on the upper bounds of the supported input data rates.
Average 1 hour table definitions on main node
Figure 5 illustrates the history table definition for the Average 1 hour table available in the main node.
The main difference compared to the current history definitions from the data collector (Figure 4) is the ‘Source Table’, which now refers to the AVG1minute table (which would refer again to current history). The duration of the history is also longer (10 years). This is possible as the amount of data on the 1-hour level is considerably smaller than in the current history. The ‘Split length’ is defined to be 6 months.
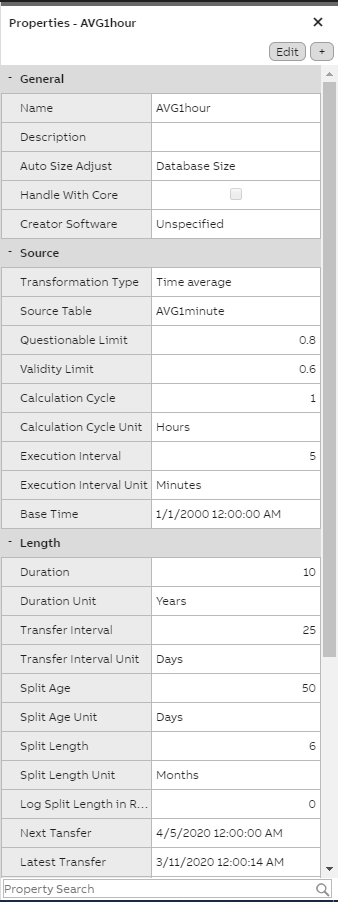
Figure 5. AVG1hour history table definitions from MAIN node.
Physical History tables
Figure 6 illustrates the physical table layout for the current history in the data collector. Upper level histories are using the same layout. The only difference is the split length, which is varying depending on the type of history.
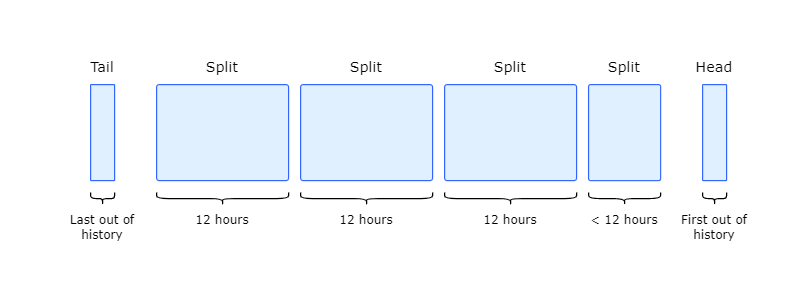
Figure 6. Physical history tables for history storing (current history in data collector node). Split size has been defined to be 12 hours. First values are stored to the ‘Head’ table and the last value out of the history length is stored to the ‘Tail’ table. The bulk of the data is stored into several ‘Split’ tables.
The history data is divided into several Split Segments. The amount and length of the splits is defined by the ‘History Length’ and ‘Split Length’ parameters. The start and end time of each split is always known based on these parameters, together with the ‘Base Time’ parameter. The new input value is written to a head. When the new value enters to the head, the previous value in the head is compressed, if so configured, and written to the newest split. If the split does not exist, it is created on the fly. As the time span of the oldest split has aged out of the defined history length, the whole split is deleted. The latest value of the deleted split is stored to the tail. This is needed to support a different kind of history fetch functionality.
The possible number of splits is between 0 and 50.
All RTDB tables, including the history split files, are stored to the database disk in %APP_DATAPATH%, e.g. to D:\RTDBData. The split file names include the date, which indicates the time frame the split file covers. The following would be split files for the date 22.12.2011 in the data collector. For each 12 hours, starting from midnight, there would be one split and the associated table definition. The head file only contains the base table name, and the tail file has the _Tail postfix.
RTDB_CurrentHistory.TableDefinition
RTDB_CurrentHistory.TableData
RTDB_CurrentHistory.TableIndex
RTDB_CurrentHistory_20111222_0000_P0200.TableDefinition
RTDB_CurrentHistory_20111222_0000_P0200.TableData
RTDB_CurrentHistory_20111222_1200_P0200.TableData
RTDB_CurrentHistory_20111222_1200_P0200.TableDefinition
RTDB_CurrentHistory_Tail.TableDefinition
RTDB_CurrentHistory_Tail.TableData
RTDB_CurrentHistory_Tail.TableIndex
Sometimes it is useful to be able to work in split level. For example, queries using the ODBC command line tool praotstx are able to operate directly using the names of the split tables (normally one works against the combination of all tables using logical table names). In addition, rtdb_scandb can be run for only one table instead of running it for all tables, which speeds up the administration many times over. Administrator tools like praotstx, rtdb_scandb and rtdb_coreinfo are discussed in detail in Management tasks.
Recalculating secondary histories
Recalculation is needed when historical values are corrected later on, and there are upper-level histories that are defined to collect data from the history tables where corrections are done. Another reason for recalculations might be that values are arriving late to the database.
Other terms for recalculation are ‘recollection’ and ‘reconsolidation’.
Recalculation is documented in detail in Recalculation. In basic PIMS-functionality (without C# calculations), recalculation is automatically done when needed.
Updated 8 months ago
