Services
The History software runs in the background as multiple Windows Services. On Windows, a list of the RTDB services can be seen using Task Manager.

Most of the service names start with "RTDB". In addition to these, there are SimbaServer (ODBC server), two Vtrin Servers (Vtrin Server and Vtrin Server RTDB Internal), VtrinLink and two OPC servers (CpmPlusKM-OpcDaServer and CpmPlusKM-OpcHdaServer).
A single computer may have multiple RTDB databases, and because of this, the database name is included into the names of the RTDB services. However, installing several RTDBs into the same machine usually makes no sense, and is not supported using standard installers.
The next sections describe in detail what is the functionality the service is responsible for, what the configuration options for each service are, and how to monitor and understand what the service is doing.
RTDB-ServiceManager
Functionality
RTDB-ServiceManager (e.g., service called RTDB D:\RTDBData in Task Manager) is the main service of RTDB. It runs as a Windows service under the local system account, and it is normally defined to be automatically started up during the computer startup (Startup Type is Automatic).
RTDB-ServiceManager controls and monitors other RTDB services.
Configuration
The list of the RTDB services to be managed is in the RTDB.INI file of the database directory (%APP_DATAPATH%). RTDB-ServiceManager cyclically tries to start other services if they are not running. The monitoring cycle is defined with the Interval_ms setting in the General section of RTDB.INI. This reduces the need for engineering in case of service crashes.
Diagnostics
RTDB-ServiceManager writes the status of the services into MessageLog (more details on MessageLog in Diagnostics). Component status (more details on component status in Diagnostics) shows what services are running and what have been set, for example, in a disabled state.
RTDB-CVMCServer
Functionality
RTDB-CVMCServer is responsible for storing real-time input data (current values) into the database. It also stores the values to current history. Before storing the values to current history, compression and other (pre)processing is applied if such is configured to be used.
A key component in current value processing is the ring buffer, which is used between data links and RTDB-CVMCServer. The two data links most often used are RTDB-EcOpcClient and VtrinLink services. These produce values to a shared memory ring buffer, from where values are consumed by RTDB-CVMCServer, which actually stores the values to the database. This procedure is asynchronous, which sometimes might be confusing when current values are fed using e.g. the Vtrin user interface.
Another task for RTDB-CVMCServer is to calculate upper-level histories from current history based on the transformations defined. Together with RTDB-Transformator, it also does upper-level history recalculations when such are requested. RTDB-CVMCServer does the history recalculation for the last period, and RTDB-Transformator takes care of all other (older) periods.
In a high availability system, RTDB-CVMCServer is involved in distributing current values between redundant main nodes.
Configuration
After installation, no additional configurations have to be done. The configuration settings are available in SimpleConfig (from Vtrin tree ‘Maintenance\Basics\Service Parameters (SimpleConfig)’. The ‘Section’ property can be used to filter by ‘*RTDB-CVMCServer’ to show settings for RTDB-CVMCServer only). There are quite many parameters available and some of them are configured based on the resources (memory, number of CPUs…). The current recommendation is that these parameters should not be changed (if the user is not an experienced RTDB user with some information about RTDB internals).
Diagnostics
Message log can be used to monitor behavior. The details of the message log are available in Diagnostics.
Sometimes it might be beneficial to be able to see diagnostics online from console. RTDB-CVMCServer can be run from console. Before that, the service should be set as disabled and stopped from services.msc. From ‘Path to executable’ in services.msc, the -service switch should be removed when the service is started as a normal process. The command line could be e.g.:
"C:\Program Files\ABB Oy\RTDB\bin\RTDB_CVMCServer.exe" D:\RTDBDatawhere D:\RTDBData is the database directory. Stopping the service from console is done by pressing Ctrl-c once. RTDB-CVMCServer is using a direct server connection to access the database. The service or process should always be stopped in a controlled way in order to preserve the contents of the used database tables. Killing a service violently e.g. from the task manager can break the tables, and, for example, cause the startup times to be increased next time due to the fact that rtdb_scandb has to fix the potentially broken tables.
Sometimes, shutting down the RTDB-CVMCServer might take some time if the size of the database and the number of variables is large. Some patience is needed to wait for the server to shut it down.
RTDB-Transformator
Functionality
RTDB-Transformator is responsible for cleaning up history tables that have aged out from the history scope. Log tables are also cleaned using similar rules.
Together with RTDB-CVMCServer, it takes care of recalculating upper-level histories. In the recalculation process, RTDB-Transformator is responsible for all but the latest period of the upper-level history.
Monitoring the available disk size and the current size of the database is also executed by RTDB-Transformator. Based on that, it automatically adjusts the history length definitions for those tables where the scope of the history is defined to be adjusted based on available disk size.
Configuration
After installation, no additional configurations have to be done. The configuration settings are available in SimpleConfig (from Vtrin tree ‘Maintenance\Basics\Service Parameters (SimpleConfig)’. The ‘Section’ property can be used to filter by ‘RTDB-Transformator’ to show settings for RTDB-Transformator only). Some of the parameters are configured based on the resources (memory, number of CPUs…). The current recommendation is that these parameters should not be changed (if the user is not an experienced RTDB user with some information about RTDB internals).
Diagnostics
Message log can be used to monitor behavior. The details of the message log are available in Diagnostics.
Sometimes it might be beneficial to be able to see diagnostics online from console. RTDB-Transformator can be run from console. Before that, the service should be set as disabled and stopped from services.msc. From ‘Path to executable’ in services.msc, the -service switch should be removed when the service is started as a normal process. The command line could be e.g.:
"C:\Program Files\ABB Oy\RTDB\bin\RTDB_Transformator.exe" D:\RTDBDatawhere D:\RTDBData is the database directory. Stopping the service from console is done by pressing Ctrl-c once. RTDB-Transformator is using a direct server connection to access the database. The service or process should always be stopped in a controlled way in order to preserve the contents of the used database tables. Killing a service violently e.g. from the task manager can break the tables, and, for example, cause the startup times to be increased next time due to the fact that rtdb_scandb has to fix the potentially broken tables.
RTDB-EcPerfMon
Functionality
RTDB-EcPerfMon collects data from Windows performance counters based on the definitions in the ec_crossrefs table.
Configuration
Configuration is done by using the ec_crossrefs table. Configuration is ready after setup. If the default set of performance counters is not enough, and new performance counters are added, one row for each variable should be created. There is no Vtrin class mapping for this table, but the ODBC interface has to be used to configure the table. There is an Excel application %APP_ROOT%\Config\Variables\RTDB_Populate_cPIMSPerfMon.xls that can be used to create ec_crossrefs rows using the ODBC interface. However, the application is quite low-level and not as straightforward to use as it could be.
Diagnostics
Message log can be used to monitor behavior. The details of the message log are available in Diagnostics.
Sometimes it might be beneficial to be able to see diagnostics online from console. RTDB-EcPerfMon can be run from console. Before that, the service should be set as disabled and stopped from services.msc. From ‘Path to executable’ in services.msc, the -service switch should be removed when the service is started as a normal process. E.g. the command line could be:
"C:\Program Files\ABB Oy\RTDB\bin\RTDB_EcPerfMon.exe" D:\RTDBDatawhere D:\RTDBData is the database directory. Stopping the service from console is done by pressing Ctrl-c once. RTDB-EcPerfMon is using a direct server connection to access the database. The service or process should always be stopped in a controlled way in order to preserve the contents of the used database tables. Killing a service violently e.g. from the task manager can break the tables, and, for example, cause the startup times to be increased next time due to the fact that rtdb_scandb has to fix the potentially broken tables.
RTDB-EmailKit
Functionality
RTDB-EmailKit sends automatic email messages to an SMTP server, based on event configurations.
It supports SSL and High Availability.
Configuration
installation:
RTDB_EmailKit.exe --install --databasepath < databasePath>
e.g. RTDB_EmailKit.exe --install --databasepath D:\RTDBData
SimpleConfig :
SectionName | Keyname | Description |
|---|---|---|
RTDB-EmailKit | SMTPServer | The TCP/IP address of the SMTP server. |
RTDB-EmailKit | SMTPServerPort (optional) | Port for the STMP server. Default : 465 |
RTDB-EmailKit | From | The name to be set up as the sender of the mail. |
RTDB-EmailKit | Credential | Windows Credential name containing the username/password for the SMTP server. |
RTDB-EmailKit | DisableAuth | Turn 'True' to disable the authentication for the server. |
RTDB-EmailKit | IgnoreCertificateErrors | Turn 'True' to ignore certificate errors and log certificate information. Default value: False |
RTDB-CVMCServer | MaxCmdAgeS | Max age (validity) of commands in CommandQueue. Too old commands are discarded. Default value: 60s |
The recipients are defined in the EventEmailRecipients table. It has to be created with the script RTDB_EmailServer.sql, which resides in the RTDB\Config directory.
Run praox as administrator (RTDB might needs to be stopped & restarted):
praox %APP_Core_DSN% -ss "%RTDBRoot%\Config\RTDB_EmailServer.sql" -summaryThe table consists of two columns: ListNumber and Address. There may be several addresses with the same list number.
Event Configuration and Event Configuration for Equipments :
Select Email Group 1...10 in the Function field of an alarm definition.
RTDB-Scheduler
Functionality
The purpose of the RTDB-Scheduler service is to run different kinds of scheduled tasks. There are some tasks that it has by default (for example tasks related to installing the product), but end users and the administrator of the system can add project-specific tasks to be executed as well.
Configuration
After installation, no additional configurations have to be done. The configuration settings are available in SimpleConfig (from Vtrin tree ‘Maintenance\Basics\Service Parameters (SimpleConfig)’. The ‘Section’ property can be used to filter by ‘RTDB-Scheduler to show settings for RTDB-Scheduler only). The current recommendation is that these parameters should not be changed (if the user is not an experienced RTDB user with some information about RTDB internals).
New tasks are assigned to RTDB-Scheduler either using TimedTasks entries (the associated table and Vtrin class both have the same name) or using the command queue mechanism.
Diagnostics
Message log can be used to monitor behavior. The details of the message log are available in Diagnostics.
RTDB-CalcScheduler
Functionality
RTDB-CalcScheduler schedules calculations that are made using the RTDB C# calculation framework. Calculations are written using C#, and compiled into .Net assembly as a dll. RTDB-CalcScheduler executes calculations based on the configuration that defines how and when calculations are executed.
Configuration
RTDB-CalcScheduler is not installed by default after setup (but will be part of the standard setup in upcoming releases).
RTDB-EcOpcClient
Functionality
RTDB-EcOpcClient collects real-time process data from OPC DA servers. OPC DA means Open Process Connectivity, Data Access interoperability specification.
RTDB-EcOpcClient collects real-time numerical values from one or more OPC DA servers. The received values are stored as RTDB current values, using a ring buffer that is operated by RTDB-CVMCServer. The user can configure the behavior, i.e. the OPC items to be collected, using the Tag class that is presented in detail in Tag and Variable.
Configuration
For each OPC item to be collected, there is one Tag instance. The properties of the Tag class that are configuring the OPC DA client are "Activity", "DaType", "DaPath", "DaFrequency", "DaDeadband", "DaTypeRedundant" and "DaPathRedundant".
Diagnostics
The behavior of RTDB-EcOpcClient can be monitored using MessageLog. The details of the message log are available in Diagnostics.
RTDB-OpcUAClient
Functionality
RTDB-OpcUAClient collects real-time process data from OPC UA servers. Functionalities of DA, HDA and AE are supported and service can run both in Windows and Linux.
Configuration
Tag or DataAccessSource and DataAccessRealtime are used to configure DA and HDA type of data. DataAccessEvent class is used to configure event collection.
Diagnostics
The behavior of RTDB-OpcUAClient can be monitored using MessageLog. The details of the message log are available in Diagnostics.
RTDB-EcModbusMaster
Functionality
RTDB-EcModbusMaster RTDB Modbus connection (RTDB_EcModbusMaster) implements a client-server connection to Modbus server over TCP/IP. The functionality of the RTDB_EcModbusMaster process and variables parameters are defined in the "EcCrossrefs" or "Tags" and "DataAccessSources" and "SimpleConfig" tables.
Configuration
Tag or DataAccessSource and DataAccessRealtime are used to configure Modbus client.
Diagnostics
The behavior of RTDB-OpcUAClient can be monitored using MessageLog. The details of the message log are available in Diagnostics.
RTDB-OpcDaServer
Functionality
RTDB-OpcDaServer is an OPC DA 2.05a compliant server component that is able to provide the current values of RTDB to any OPC DA client. Each variable instance in RTDB is mapped to an OPC item, and each current value of a variable is mapped to a value of an OPC item. OPC clients can browse the address space of RTDB based on the Path definitions available.
Configuration
After installation, no additional configurations have to be done. OPC proxies have been installed, and all the COM configurations have also been done. The service is running under the admin user that has been provided during the setup phase, in order to make connecting to OPC clients easy.
There are some configuration options available in the file %APP_ROOT%\config\OpcIniFiles\RtdbOpcDaServer.ini.
Many of the configuration parameters are documented also in the comments of the initialization file. The initialization file is case-sensitive. If the administrator wants to change some parameters, a couple of things have to be taken into account:
- The server has to be restarted after the configuration change.
- The initialization file is case-sensitive.
- The initialization files of all OPC servers are automatically managed by RTDB-Scheduler, and if nothing is done to prevent automatic management, they are cyclically overwritten. To disable the automatic overwrite, the
RTDB.inifound from the database directory%APP_DATAPATH%should be modified. InRTDB.ini, there is a section similar to ‘[RTDB-OpcDaServer D RTDBData]’. Under this section, one additional line should be added:DisableAutoConf=1This will prevent the automatic initialization file overwrite of this particular OPC server. Another mechanism to prevent the overwrite is to simply set the initialization file as read-only, but this is not as good, as it is then not recognized when RTDB is upgraded to a newer version and may cause problems for the upgrade procedure.
Diagnostics
RTDB-OpcDaServer writes the diagnostics information into the folder: %APP_DATAPATH%\diag\OpcServer\.
There are two different kinds of log files available:
Interface logs show what OPC DA interface functions have been called and returned. Object logs show what kind of OPC objects the OPC clients have created to the address space of the server. From the interface logs, it is easy to check whether some OPC client has been able to connect to the server, for example (Message Server instance created... should be visible), or to understand the detailed behavior of either the server or client.
The object logs show what the initialization parameters at the startup time of the server have been, and what the currently available OPC objects in the memory of the OPC server are. By default, the OPC Server and OPC Group objects are displayed.
A new interface log and a new object log is created every time the server is restarted. The last three log files are saved.
RTDB-OpcHdaServer
Main article: OPC Classic DA and HDA servers
Functionality
RTDB-OpcHdaServer is an OPC HDA 1.20 compliant server component that is able to provide historical data from RTDB to any OPC HDA client. The server functionality includes:
- Browsing the available variables and aggregates in RTDB.
- Reading the current history and aggregated history using synchronic and asynchronic interface calls.
- using ReadRaw
- using ReadAtTime
- using ReadProcessed
- Subscribing the latest changes to history tables using AdviseRaw or AdviseProcessed functionality.
- Reading the attribute values of OPC items.
Configuration
After installation, no additional configurations have to be done. OPC proxies have been installed, and all the COM configurations have also been done. The service is running under the admin user that has been provided during the setup phase, in order to make connecting to OPC clients easy.
There are some configuration options available in the file %APP_ROOT%\config\OpcIniFiles\RtdbOpcHdaServer.ini.
Many of the configuration parameters are documented in the comments of the initialization file. The initialization file is case-sensitive. If the administrator wants to change some parameters, a couple of things have to be taken into account:
- The server has to be restarted after the configuration change.
- The initialization file is case-sensitive.
- The initialization files of all OPC servers are automatically managed by RTDB-Scheduler, and if nothing is done to prevent automatic management, they are cyclically overwritten. To disable the automatic overwrite, the
RTDB.inifound from the database directory%APP_DATAPATH%should be modified. InRTDB.ini, there is a section similar to ‘[RTDB-OpcHdaServer D RTDBData]’. Under this section, one additional line should be added:DisableAutoConf=1This will prevent the automatic initialization file overwrite of this particular OPC server. Another mechanism to prevent the overwrite is to simply set initialization file as read-only, but this is not as good, as it is then not recognized when RTDB is upgraded to a newer version and may cause problems to the upgrade procedure.
Diagnostics
RTDB-OpcHdaServer writes the diagnostics information into the folder: %APP_DATAPATH%\diag\OpcServer\
There are two different kinds of log files available:
Interface logs shows what OPC HDA interface functions are called and returned. Object logs show what kind of OPC objects the OPC clients have created to the address space of the server. From the interface logs, it is easy to check whether some OPC client has been able to connect to the server, for example (Message Server instance created... should be visible), or to understand the detailed behavior of either the server or client.
The object logs show what the initialization parameters at the startup time of the server have been, and what the currently available OPC objects in the memory of the OPC server are. By default, OPC Server and OPC item objects are displayed.
A new interface log and a new object log is created every time the server is restarted. The last three log files are saved.
RTDB-OpcUAServer
Main article: OPC UA Server
Vtrin Server
Main article: Vtrin Server
Functionality
Vtrin Server (also known as Vtrin-NetServer) is a service that provides remote access to the Vtrin user interface client. (In addition, local connections are usually done through Vtrin Server, as it provides an additional protection layer for the database tables.)
The Vtrin user interface connects the database using the services of the Vtrin Server as the very first step when the client is started.
Configuration
After installation, no configuration changes are required (or conditions where configuration changes are required should at least be very rare). Vtrin Server reads the configuration on startup from the file Vtrin-NetServer.exe.config, which is located in the same directory where Vtrin Server is started. The directory can be checked from the services.msc properties ‘Path to executable’. This directory is a bit different depending on the operating system type (64 or 32 bit), or the type of the RTDB installation (Data Collector or Main).
The configuration file is XML and contains, for example, details of what IP addresses and ports are used, what database to connect to, and what kind of buffer sizes and timeouts are available for different kinds of communication scenarios. The meaning of each parameter is briefly and quite technically described using XML comments.
Sometimes it is valuable to run the service interactively from command line. This can be done by disabling the service from services.msc and stopping it. The command line can be copied from the services.msc properties ‘Path to executable’, and adding -d to the end. For example:
"C:\Program Files\ABB Oy\Vtrin35\Vtrin-NetServer.exe" -dStopping the service is done by pressing the ‘ESC’ button. (Note that this is quite different to what is done for some other services that are stopped using Ctrl-c. For Vtrin-NetServer, this would violently terminate the program and potentially break database tables.)
Diagnostics
Logging is done to the folder %APP_DATAPATH%\diag\. Log files are named by combining ‘Vtrin Server’ with the date when the log information has been generated, e.g. Vtrin Server_2011-12-31. The content of the file can be verbose, and it also contains a lot of low-level information that can be valuable in troubleshooting situations for the developers and for customer support. For the administrator of the system, the information usually does not tell very much.
Vtrin Server RTDB Internal
Functionality
Vtrin Server RTDB Internal (also known as Vtrin-NetServer Internal) is a service that provides remote access to computers in the hierarchical systems that run older versions than 5.0. In some future version, the installation of the Vtrin Server RTDB Internal service may be omitted completely by default.
Configuration
After installation, no configuration changes are required (or conditions where configuration changes are required should at least be very rare). Vtrin Server RTDB Internal reads the configuration on startup from the file Vtrin-NetServer-RtdbInternal.exe.config that is located in the same directory where Vtrin Server RTDB Internal is started from. The directory can be checked from the services.msc properties ‘Path to executable’. This directory is a bit different depending on the operating system type (64 or 32 bit), or the type of the RTDB installation (Data Collector or Main).
The configuration file is XML and contains, for example, details of what IP addresses and ports are used, what database to connect to, and what kind of buffer sizes and timeouts are available for different kinds of communication scenarios. The meaning of each parameter is briefly and quite technically described using XML comments.
Sometimes it is valuable to run the service interactively from command line. This can be done by disabling the service from services.msc and stopping it. The command line can be copied from the services.msc properties ‘Path to executable’ and adding -d at the end. For example:
"C:\Program Files\ABB Oy\Vtrin35\Vtrin-NetServer-RtdbInternal.exe" -dStopping the service is done by pressing the ‘ESC’ button. (Note that this quite different to what is done for some other services that are stopped using Ctrl-c. For Vtrin Server RTDB Internal, this would violently terminate the program and potentially break database tables).
Diagnostics
Logging is done to the folder %APP_DATAPATH%\diag\. Log files are named by combining ‘Vtrin Server RTDB Internal’ with the date when the log information has been generated, e.g. Vtrin Server_2011-12-31. The content of the file can be verbose, and it also contains a lot of low-level information that can be valuable in troubleshooting situations for the developers and for customer support. For the administrator of the system, the information usually does not tell very much.
Vtrin-NetSync
Main article: NetSync - Getting started
VtrinLink
Functionality
VtrinLink is a service that fetches numerical process data (current values and current history) from data collector nodes into the main node. The hierarchical system architecture is described in Hierarchical systems using tags.
VtrinLink reads the Tag configuration available in the Main node and, based on that information, connects to one or more data collector nodes. It uses the services of Vtrin Server RTDB Internal to connect to the data collectors.
VtrinLink uses queued current values (CurrentValue2 class) to get numerical values from data collectors as soon as possible. In case of network breaks between the main node and data collector node, it uses values stored to the current history of the data collector to backfill missing values to the main node, once the network break is over. A similar backfill is done if the main server is shut down for some reason.
In case there are redundant tags from redundant data collectors, VtrinLink is connected to both data collectors simultaneously and data is provided where it can be provided the fastest.
Configuration
After the first data collector has registered itself to the main node, RTDB-Scheduler starts the post-installation procedure, which installs services that are needed to manage the communication between the Main node and Data collectors. VtrinLink is one of these services; the two other ones are RTDB-TagConsistencyController and RTDB-EventForwarder. This configuration procedure is automatic and the administrator is not required to do any additional steps. If the services are not installed automatically after having the main node and at least one data collector installed, the first thing to ensure is that the firewall is not blocking the communication between the main node and data collectors. The complete list of ports that are required to be open is available in the installer documentation (either 443 or 1583, depending on the RTDB version of the data collector).
If the data collector version is 4.6 or older, the main server must have SimbaServer turned on in
RTDB.ini. See section SimbaServer.
Every time a new data collector is installed to the hierarchical system, the VtrinLink service, as well as RTDB_TagConsistencyController and RTDB-EventForwarder, are stopped and RTDB-Scheduler reconfigures and restarts the services automatically.
The configuration files of VtrinLink are available in the folder %APP_ROOT%\Config\VtrinLinkIniFiles\.
There is a main initialization file VtrinLink.ini that refers to data collector specific initialization files (VtrinLink_<datacollectorname>). Configuration files are automatically generated and managed by RTDB-Scheduler.
Diagnostics
By default, Log files are stored in the folder: %APP_DATAPATH%\diag\
There are log files of the last ten days available (the amount of log files and naming can be controlled from VtrinLink.ini). The content of log files is quite low-level and mainly targeted for troubleshooting.
RTDB-EventForwarder
Functionality
RTDB-EventForwarder fetches external OPC events from data collectors and inserts those into the main node. The hierarchical system architecture is described in Hierarchical systems using tags.
By default, the events are fetched every 30s from each data collector. If there are redundant data collectors, RTDB-EventForwarder is connected to both data collectors and events are fetched from where it can be done the fastest.
In case of network breaks between the main node and data collector node, the missing events are backfilled to the main node once the network break is over. A similar backfill is done if the main server is shut down for some reason.
RTDB-EventForwarder maintains a date-time marker for each data collector on what the last events to be fetched from data collector have been. This marker information is available in SimpleConfig in ABB Ability™ History (from Vtrin tree ‘Maintenance\Basics\Service Parameters (SimpleConfig)’). (High availability system is described in High availability .)
In older versions, the timestamps might be available in a separate text file in: %APP_ROOT%\Config\EventForwarderIniFiles\
Configuration
After the first data collector has registered itself to the Main node, RTDB-Scheduler starts the post-installation procedure, which installs services that are needed to manage the communication between the Main node and Data collectors. RTDB-EventForwarder is one of these services.
This configuration procedure is automatic and the administrator is not required to do any additional steps. If the services are not installed automatically after having the main node and at least one data collector installed, the first thing to check is a possible firewall blocking the communication between the main node and data collectors. The complete list of ports that are required to be open is available in the installer documentation (either 443 or 1583, depending on the RTDB version of the data collector).
If the data collector version is 4.6 or older, the main server must have SimbaServer turned on in
RTDB.ini. See section SimbaServer.
The configuration files of RTDB-EventForwarder are available in the folder %APP_ROOT%\Config\EventForwarderIniFiles\.
There is a main initialization file RTDB-EventForwarder.ini that refers to data collector specific initialization files (RTDB-EventForwarder_<datacollectorname>). The configuration files are automatically generated and managed by RTDB-Scheduler.
Diagnostics
Component status information is available in Vtrin (see the description of component status from Diagnostics). There is the main component status ‘RTDB-EventForwarder’ that has all the data collectors and the main node as children. The main component status reports how many events have been inserted into the main node over the last 5 minutes (a moving average calculated every 10 seconds). The data collector node components report how many events were fetched last time, and is the network connection to the data collector ok.
Log files are stored in the folder: %APP_DATAPATH%\diag\EventForwarder\
The main log file is RTDB_EventForwarderX.log, where X is a number from 1 to 3. A new file is generated every time the service is started. The amount of information in the main log file is limited, as there is a separate log file for every data collector in:
%APP_DATAPATH%\diag\EventForwarder\diag\<DataSourceNameOfDc>These data collector specific log files contain possible exceptions that happen during the processing of events. Although considered normal behavior, any possible network breaks are reported with stack traces as well.
RTDB-TagConsistencyController
Functionality
RTDB-TagConsistencyController (TCC) is responsible for maintaining the tag configuration in hierarchical systems. The hierarchical system architecture is described in Hierarchical systems using tags. Usually tags are originally created in data collector nodes, and RTDB-TagConsistencyController brings the definitions into the main node automatically. Also, if the tag configuration is modified, RTDB-TagConsistencyController synchronizes the tags between the nodes.
RTDB-TagConsistencyController executes a full tag consistency check during the startup of the server. After that, it is relaying the events received from the Tag class. A full check is also done for the related data collectors after a network break.
When tags are deleted, RTDB-TagConsistencyController uses the information stored in the ‘TagDeleted’ class to be able to handle deletions that occur during network breaks. Once a tag has been deleted, it can’t be created again with the same Id (GUID) without first removing it from the ‘TagDeleted’ class from all related nodes.
Configuration
After the first data collector has registered itself to the main node, RTDB-Scheduler starts the post-installation procedure, which installs services that are needed to manage the communication between the Main node and Data collectors. RTDB-TagConsistencyController is one of these services.
This configuration procedure is automatic and the administrator is not required to do any additional steps. If the services are not installed automatically after having the main node and at least one data collector installed, the first thing to check is a possible firewall blocking the communication between the main node and data collectors. The complete list of ports that are required to be open is available in the installer documentation (either 443 or 1583, depending on the RTDB version of the data collector).
If the data collector version is 4.6 or older, the main server must have SimbaServer turned on in
RTDB.ini. See section SimbaServer.
The configuration files of RTDB-TagConsistencyController are available in the folder %APP_ROOT%\Config\TccIniFiles\.
There is a main initialization file RTDB-TagConsistencyController.ini that refers to data collector specific initialization files (RTDB-TagConsistencyController_<datacollectorname>). The configuration files are automatically generated and managed by RTDB-Scheduler.
Diagnostics
Component status information is available in Vtrin (see the description of component status from section Diagnostics. There is a main component status ‘RTDB-TagConsistencyController’ that has all the data collectors and the main node as children. Currently there is only support to see if the network connection to data collectors is ok.
Log files are stored in the folder: %APP_DATAPATH%\diag\TagConsistencyController\
There is a log file for each day, and log files for the last 30 days are preserved. The log files contain information about events generated by the Tag class, and what actions RTDB-TagConsistencyController has executed based on consistency checks. In addition, there is information about possible network breaks between the main node and data collectors.
RTDB-ConsistencyController
Functionality
RTDB-ConsistencyController is only available in high availability main nodes (redundant main node). Together with RTDB-CVMCServer, it keeps tables under redundancy control synchronized between redundant main nodes.
High availability system architecture and specialities are described in detail in High availability.
Configuration
Configuration does not require any additional steps after successfully installing a redundant main node pair with a dedicated 1GB network between the main nodes.
The configuration is done in SimpleConfig (from Vtrin tree ‘Maintenance\Basics\Service Parameters (SimpleConfig)’ (the rows where the section is ‘RTDB-ConsistencyController’). There are 26 parameters available and some of them are configured based on the resources (memory, number of CPUs…). The current recommendation is that these parameters should not be changed (if the user is not an experienced RTDB user with insight information about RTDB high availability features and how they work).
Diagnostics
There are two dedicated diagnostics and monitoring displays in the Vtrin main tree ‘Maintenance\System\Redundancy\’.
CSCommon-SupportService
By installing CSCommon-SupportService, you do not need to run all tools with “Run As Administrator”. CSCommon-SupportService is installed as follows:
- Run as admin: RTDB Software Command prompt (preferably 64-bit)
CSCommon_SupportService -installnet start "CSCommon Support Service"
CpmPlusKM-OpcDaServer
Functionality
There are two different instances of the OPC DA server in data collector nodes (Starting from version 4.5, CpmPlusKM-OpcDaServer was removed from the main node installation as a redundant functionality). The purpose of RTDB-OpcDaServer is to provide data from the local RTDB database. CpmPlusKM-OpcDaServer, when installed into a data collector node, is fetching data from the main node of that particular data collector instead of getting it from the local database.
Configuration
The configuration is identical with the configuration of RTDB-OpcDaServer. the only difference is that the name of the configuration file is CpmPlusKMOpcDaServer.ini.
Diagnostics
The diagnostics is identical to what is available for RTDB-OpcDaServer.
CpmPlusKM-OpcHdaServer
Functionality
There are two different instances of the OPC HDA server in data collector nodes. (Starting from version 4.5, CpmPlusKM-OpcHdaServer was removed from the main node installation as a redundant functionality.) RTDB-OpcHdaServer provides data from the local RTDB database. CpmPlusKM-OpcHdaServer fetches data both from the data collector and main node instead of getting it from only the local database. This behavior is called seamless history server. The idea in a seamless history server is that the newest data, and for example trend updates, are fetched from the local database. When the query is such that it cannot be served using the limited amount of data available in the data collector, it is forwarded to the main server. This behavior enhances the performance and overall scalability of the historical data fetches.
Configuration
The configuration is identical with the configuration of RTDB-OpcHdaServer. The only difference is that the name of the configuration file is CpmPlusKMOpcHdaServer.ini.
Diagnostics
The diagnostics are identical to what is available for RTDB-OpcHdaServer.
SimbaServer
Functionality
SimbaServer provides ODBC access to RTDB for remote clients. Starting from RTDB 5.0, the SimbaServer service is no longer configured in RTDB.ini by default.
Configuration
To enable SimbaServer, enter the following setting to the [Services] section of RTDB.ini:
SimbaServer=ONSimbaServer is needed if the hierarchical cPIMS system also contains an older version of RTDB than 5.0.
No other changes are needed after the installation.
RTDB-CalcService
Functionality
RTDB-CalcService is the service that is responsible for the functionality of the Calculation Tool. For more details, see Calc service and processes - CalcService.
Configuration
See Calculation Tool configuration.
Diagnostics
See Calculations - Troubleshooting.
Internet Information Services (IIS)
Starting from RTDB 5.0, IIS is no longer required and it is not installed during the installation. Instead, the Vtrin Server service acts as the Web Server that serves the Vtrin ClickOnce installations. However, if the computer needs IIS for some other purposes, some special configuration is needed. This is because, by default, the Vtrin Server uses the same ports (80, 443) as IIS. If IIS is already present before RTDB installation, the RTDB installation defines IIS to listen to different ports and defines port forwarding from Vtrin Server to IIS for http and https traffic. If IIS is installed afterwards, you need to reinstall Vtrin Server to do the port forwarding configuration by using the following command:
"%app_root%\config\featureinstall\app_featureinstaller.bat" /reinstall Vtrin-NetserverVtrin-NotificationService
Prerequisites
Installation of .NET Core 8.0 is required. You can check with command dotnet --info whether the correct version is already installed. To install, download and run the installer from https://dotnet.microsoft.com/en-us/download/dotnet. Select the ".NET Desktop Runtime" package for .NET 8.0.
Functionality
Vtrin-NotificationService is a service that enables you to subscribe interesting events from your system to your mobile device or email. For more details, see Notification Service.
Configuration
Notification service is not part of the default ABB Ability™ History installation, but needs to be installed separately. Below are the installation instructions.
Vtrin-NotificationService <parameter> [PARAMETERVALUE] ...
Argument | Short | Description |
|---|---|---|
--connectionstring [CONNECTIONSTRING] | -c [CONNECTIONSTRING] | Connection string to the database. |
--logfile [PATH] | -l [PATH] | Path for logfile. |
--service | -s | Run as a service. |
--install | -i | Install as a service. |
--remove | -u | Uninstall the service. |
--verbose | -v | Enable verbose. Display/log more details. |
Example: We are installing the service with database connection string "C:\RTDB1\rtdbdata". A log file will be kept in folder "C:\Temp" under the name "notificationservicelog.txt". And the log will be in verbose mode (-v) with more detailed messages. The installation command line in this case would be:
Vtrin-NotificationService -i -c C:\\RTDB1\\rtdbdata -l C:\\Temp\\notificationservicelog.txt -vDiagnostics
Message log can be used to monitor behavior.
Install the service with command "--logfile [PATH]" and check the log file for diagnostic messages.
Vtrin Secure Remote Access
Vtrin Secure Remote Access (VtrinSRA) is an independent module of ABB Ability History that provides secure, end-to-end remote access using OAuth2 authentication, across multiple network layers. It only needs outbound HTTPS (port 443) connections from the client and the target system. It can tunnel any TCP/IP traffic in both directions, and support for UDP may be added in the future.
VtrinSRA delivers a good engineering experience, efficient tooling, easy access control, end-to-end security, and real-time auditing to ensure safe and efficient remote service management.
Essentially, it solves the problem of "How do you reach and control remote devices behind a firewall and/or without direct internet connection?".
The key idea is to be secure and easy to use
Configuration
Gateway
Software Package
- cpmPlusVtrinRemoteAccessClientProvider
- cpmPlusVtrinServer
NOTE:Currently, the system relies on having a cpmPlusHistory database installation
The monolithic installer does not currently support installing the client provider components, so unless set up manually, only the package installer (Linux/Windows) experimental can set this node up.
Intermediate Node (optional)
Software Package
- cpmPlusVtrinServer
- cpmPlusVtrinNetSync
NOTE:Currently, the system relies on having a cpmPlusHistory database installation
Vtrin-NetSync must be configured to securely forward the part of the equipment model the remote access uses to the next level.
Vtrin-NetSync must be configured to use wss connection to connect also to local node, with other types of connections, the forwarding will NOT work.
Target
Software Package
- cpmPlusVtrinRemoteAccessPackage
NOTE:If you are running on a Windows system with the cpmPlusHistory (monolithic installer) already installed, the software is included._
If you are on Debian Debian-based Linux system, remember that package names are case sensitive, so use all lowercase.
After installation, navigate to the installation directory
Windows:- C:\Program Files\ABB Oy\RTDB\bin
Linux:- /usr/share/cpmplus/netcore on Linux
Find a file:-VtrinRaxess.config.example.json; make a copy and rename it to VtrinRaxess.config.json and edit this new file with all specific configuration parameters described below:-
Gateway address
Specify the address of the gateway (or intermediate) server with the Gateway parameter.
Gateway: "wss://mygateway/view"
If needed, the username and password for the gateway connection must be stored in the corresponding Windows Vault (or on Linux, the cpmplus-implemented equivalent). This can be done (on all platforms) with the command:
runcpm Vtrin-NetServer --username myuser --password mypassword --addcredentials wss://mygateway/view
Vtrin-NetServer is required
Certificate
In the configuration file, you need to provide a https certificate for the connection
The first option is a file path to the .p12 or .pfx common security format file (the file needs to have been saved with the password "vtrincert")
Certificate: "/usr/share/cpmplus/vtrincert.p12"
Or, on Windows, it can be a "friendly name" of a certificate located in the Local Computer's "Personal" certificate store (can be viewed by starting "Manage Computer Certificates" from start menu).
The certificate "Issuer" field has to contain the correct fully qualified domain name (FQDN) of the computer correctly set "eg. CN=snack.ankkalinna.fi.abb.com". Incorrect FQDN will cause connections to fail. Ideally, the certificate should be trusted by all the clients' computers that are going to be connecting.
The current development version has a temporary setting to accept untrusted certificates as long as the FQDN matches, but that will change soon. There will be a proper way to explicitly trust the certificate so it will be more secure
A way to accept untrusted certificates will be added.
OAuth2 /Authenticate Users
To be able to use OAuth2, you need to set up the authentication provider:- Azure app registration_or _KeyCloak server and provide configuration, ClientId and Secret to Vtrin Remote Access.
| Field (Required*) | Type | Comment |
|---|---|---|
| ServerAddress* | string | OAuth2 provider configuration URL |
| ClientID* | string | OAuth2 Client Id |
| Secret* | string | OAuth2 Secret |
OAuth2Config:
{
 ServerAddress: "https://login.microsoftonline.com/abb.onmicrosoft.com/v2.0/.well-known/openid-configuration",
 ClientId: "aaaaaaaa-bbbb-cccc-dddd-eeeeeeeeeeee",
 Secret: "xxxxxxxxxxxxxxxxxxxxxxxxxxxxxxxxxxxxxxxxxxxx"
}
Client
The client installation process is as straightforward as possible. Once installed, the client includes an automatic self-update feature. Every time the client starts, it checks for newer versions and downloads updates in the background, so users don't have to update it manually.
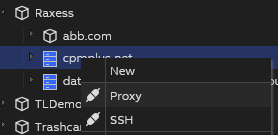
To begin a remote access session, users first navigate to the target device in the gateway web interface. By right-clicking on the device, a dialog appears, allowing them to select the tunneling type. After choosing either Proxy or SSH (see below for more), they initiate the connection directly from the web interface.
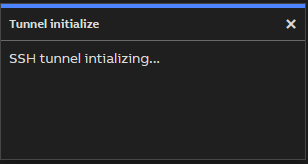
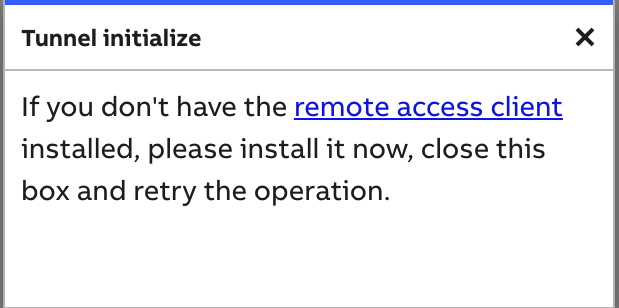
The browser will try to launch the Vtrin Remote Access URL handler. If the handler is installed, it will launch and establish a connection to the gateway. Once it creates the connection, this dialog will close. If the handler is not detected within five seconds, the dialog content will change and offer an option to download the client.
If you wish to learn more refer to Tutorials - Vtrin Secure Remote Access (VtrinSRA)
Updated 9 months ago