Create an Alarm Trend for Active Alarms table
This tutorial will give an example on how to create a "Send To" trend display for Active Alarms that allows you to view one variable/equipment event alarm at a time. This means that on the Active Alarms table we can select variable or equipment event and send it to a trend display.
We will create separate trend displays for variable and equipment event handling. We use AlarmLogRow as one of the source classes, but as currently the chart widget cannot read AlarmLogRow class, we need to use different helper widgets to make data visible on our charts.
With this, the tutorial provides in some ways a custom made "Send To" trends for our Active Alarms display, but this documentation may be utilized in other customer cases as well.
Step 1: Create a Trend display
To start with, we need to open our View and create two empty trend displays. Locally on the server the View tool can be accessed by navigating on a web browser to https://localhost/view.
We will create the trends to an already existing folder named "Send To" that we have created for all our "Send To" displays. After this, we will name the Trends accordingly: Alarm Trend (Variable) and Alarm Trend (Equipment) .
Step 2: Configure UI References
Next, we need to associate our trends with ourActive Alarms display in the Engineering UI. This can be done from the main menu of Engineering UI by opening Applications -> User Interface -> UI References. In the UI Reference display we can add new references to our Alarm Trends from the Edit button and define the following:
- Text: Name of the Alarm Trends
- Sort Key: This allows you to reorder the items in the Send To menu. You can leave this as default, but it cannot be left empty and must be unique for each SourceType (in our case AlarmLogRow).
- Source Type: Name of the class we want to configure the Alarm Trends for. This should match the class we will select for our Alarm Trends later on. As we are creating the trends for the Active Alarms, our source will be AlarmLogRow class.
- Additional Mask: We define these for both trends to determine that the trends show only not null values. For Variable trend we define NOT Variable = null and for Equipment event trend we define NOT Instance = null AND NOT Property = null.
- Target Type: TreeNode
- Target ID: Here we instert the ID:s of our Alarm Trends. We can find the ID under the dashboard definitions menu.
Remember to commit changes before closing the UI References window. Now if we go to Active Alarms display in our Engineering UI, right-click on one of the alarms and select "Send To" it should give us our Alarm Trend as an option.
Step 3: Create Alarm Trend for Variables
Now that we have connected our trends with the Active Alarms, we can start building our trends. To visualize the chosen variable data on the trend, we have a few steps to cover and scripting is the most important part. In our example we will add a bit of coding as well that we will explain and show below.
-
Add data to chart: Press the chart and from the chart definitions open the Items menu. Here we will Add two items.
- Item 1: Variable: as the Source we choose Process History, X Property: Time, Y Property: Value, Y Scaling: Common. You may also define the type and color for the data on the chart. In our example we use Trend type and color blue. These settings will now show the chosen variables values on the trend within the given time span (timebar definitions).
- Item 2: AlarmLogRow: as the Source we choose Alarm log row, X Property: Event Time, Y Property: Value, Y Scaling: Common. This will now show our active alarm event and time of the event.
-
Add Class Instance: Then we add one data helper widget called Class Instance. Class instance is an invisible widget when we exit the edit mode, but we will still place is neatly in a corner where we have empty space. Now from the Class Instance property settings for the Source we choose the Alarm Log Row and as Query Mask we insert NOT Variable = null.
-
Add Context Handler: Then on dashboard property definitions we add one Context Mapper called Context Handler, that will handle the Class Instance we added. We open the Context Handler settings, Add new and define the following:
- Class: Alarm log row
- Targets: Open further settings, Add new target, choose the Class Instance as the widget to be handled. We named ours as AlarmLogRow as shown on picture below. Remember to save settings before closing.
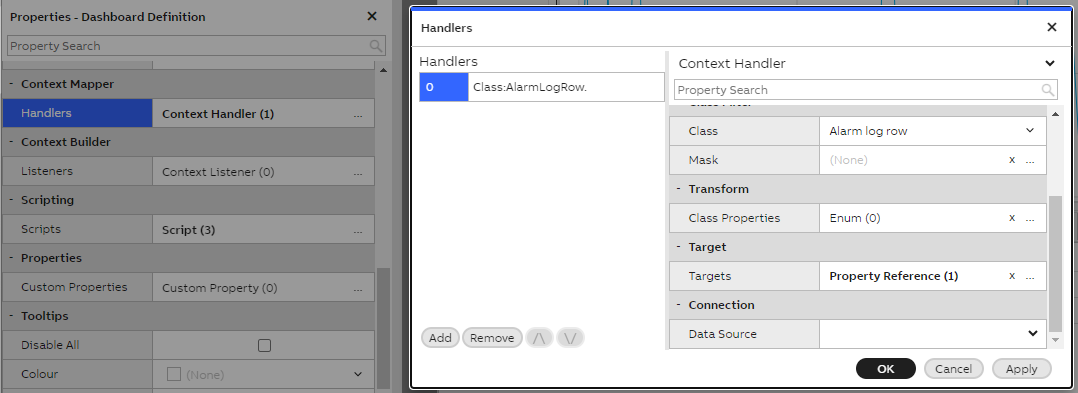
Class Instance as the target of Context Handler on variable alarm trend display
- Add Scripting: Now lastly we will add the scriptings that are needed to show our data on the trend as intended. In our example we add three scripts. We can do this by opening the Script settings on the dashboard property definitions and Add scripts as follows:
- Script 1:
- Trigger type: Property value
- Event source: Open settings and choose Class Instance as the widget. Then from selection below choose Instance > Variable.
- Targets: Add new, Action: Set Property value, Target: Choose chart as the target widget and from selection below choose Items >[0] > VariableId.
- Script 2:
- Trigger type: Property value
- Event source: Open settings and choose Class Instance as the widget. Then from selection below choose Instance > Variable.
- Script:
return {Exact: [p.EventData], Text: null}; - Targets: Add new, Action: Set Property value, Target: Choose chart as the target widget and from selection below choose Items >[1] > Masking > Variable. This will show the active alarm event(s) on the chart.
- Script 3: Lastly we want the event to be shown on the chart in a way that shows the variable data both before and after the event, so we will further write a script that allows our event to be shown at a point of one fourth from the right side of the chart. As the end result, our event will be shown on trend as the trend example below shows (one fourth to the left from the right edge).
- Trigger type: Property value
- Event source: Open settings and choose Class Instance as the widget. Then from selection below choose Instance > EventTime.
- Script:
if(!p.EventData) return null;
const {cLockValue} = mia_require("widgets/timebar/timebar_enums");
const timebar = p.Dashboard.GetWidgetByName("Time Bar");
const rightpad = timebar.TimeSpan.Get().Divide(4);
const endtime = rightpad.AddToDateTime(p.EventData);
timebar.EndLockValue.Set(cLockValue.Auto);
timebar.EndTime.Set(endtime);
return p.EventData;
- Script 1:
Now we have the following looking Trend display that shows time and data of our selected variable and the active alarm event(s). We can test that our Trend works by opening the Active Alarms table in Engineering UI, right-clicking on chosen alarm and choosing Send To Alarm Trend.
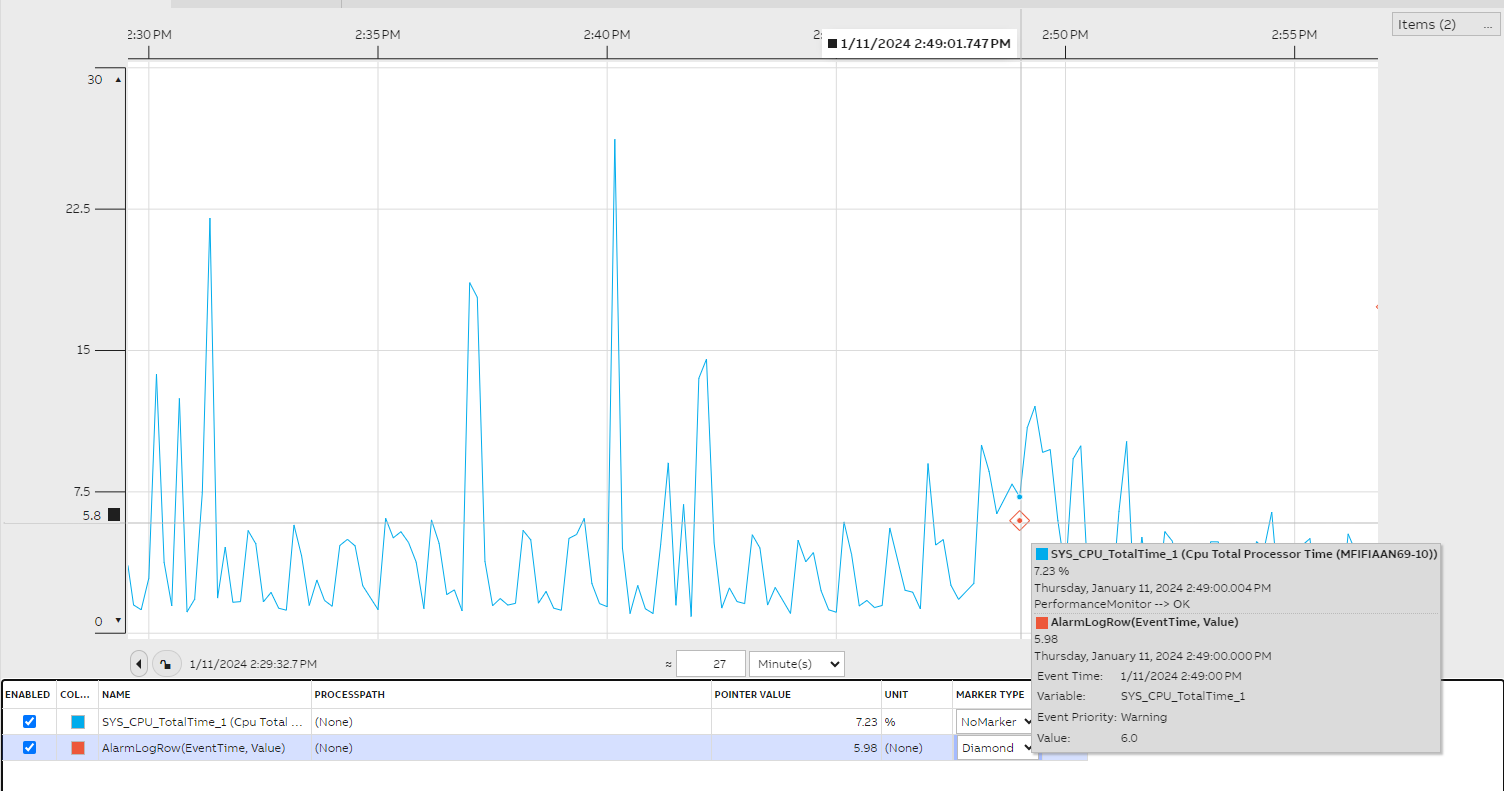
Example Active Alarms "Send To" Trend display for variable events
Step 4: Create Alarm Trend for Equipment events
Creating an Alarm Trend for equipment events is similar to the process above, but scripting source and targets differ. Let us go through the steps for this trend.
-
Add data to chart: Press the chart and from the chart definitions open the Items menu. Here we will Add two items.
- Item 1: Property: as the Source we choose Equipment History, X Property: Time, Y Property: Value, Y Scaling: Common. You may also define the type and color for the data. On our example we use Trend type and color blue.
- Item 2: AlarmLogRow: as the Source we choose Alarm log row, X Property: Event Time, Y Property: Value, Y Scaling: Common.
-
Add Class Instance: As the Source we choose the Alarm Log Row and as Query Mask we insert NOT Instance = null AND NOT Property = null.
-
Add Context Handler: We open the Context Handler settings, Add new and define the following:
- Class: Alarm log row
- Targets: Open further settings, Add new target, choose the Class Instance as the widget to be handled. We named ours as AlarmLogRow so we choose that. Remember to save settings before closing.
-
Add Scripting: Now lastly, we will add the scriptings that are needed to show our data on the trend as intended. Again, we want our trend to show data of selected equipment property and show property event(s) that caused the alarm. In our example we add five scripts. We can do this by opening the Script settings on the dashboard property definitions and Add scripts as follows:
- Script 1:
- Trigger type: Property value
- Event source: Open settings and choose Class Instance as the widget. Then from selection below choose Instance > Instance.
- Targets: Add new, Action: Set Property value, Target: We choose our chart as the widget and then from selection Items >[0] > Path.
- Script 2:
- Trigger type: Property value
- Event source: Open settings and choose Class Instance as the widget. Then from selection below choose Instance > Property.
- Script:
return p.Sender.GetFormattedValue("Property"); - Targets: Add new, Action: Set Property value, Target: We choose our chart as the widget and then from selection Items >[0] > Property.
- Script 3:
- Trigger type: Property value
- Event Source: Open settings and choose Class Instance as the widget. Then from selection below choose Instance > EventTime.
- Script:
if(!p.EventData) return null;
const {cLockValue} = mia_require("widgets/timebar/timebar_enums");
const timebar = p.Dashboard.GetWidgetByName("Time Bar");
const rightpad = timebar.TimeSpan.Get().Divide(4);
const endtime = rightpad.AddToDateTime(p.EventData);
timebar.EndLockValue.Set(cLockValue.Auto);
timebar.EndTime.Set(endtime);
return p.EventData;
- Script 4:
- Trigger type: Property Value
- Event source: Open settings and choose Class Instance as the widget. Then from selection below choose Instance > Property.
- Script:
return {Exact: [p.EventData], Text: null}; - Targets: Add new, Action: Set Property value, Target: We choose our chart as the widget and then from selection Items >[1] > Masking > Property.
- Script 5:
- Trigger type: Property Value
- Event source: Open settings and choose Class Instance as the widget. Then from selection below choose Instance > Instance.
- Script:
return {Exact: [p.EventData], Text: null}; - Targets: Add new, Action: Set Property value, Target: We choose our chart as the widget and then from selection Items >[1] > Masking > Instance.
- Script 1:
Now again, we can make sure our trend works by choosing an Equipment Event from the Active Alarms table in Engineering UI and Send To our Equipment Alarm Trend. The data should appear on the Trend similarly as on the variable trend.
Updated 6 months ago