Create a trend display on View
This article will guide you through how to create a new trend display and give a few examples on how to modify the appearance according to your needs.
This guide includes:
- How to create a new trend and configure data on it (variables or equipment model properties)
- How to modify appearance of data on chart
- How to modify data information shown on legend
- How to use filters for single properties on chart
- How to visualize events with markers on chart
Getting started
There are two ways to start with:
- You can navigate to My Dashboards on History and from there press Add New that shows on the screen, choose Trend from the dropdown menu.
OR
- Navigate to the dashboard editor on address https://{your History url}/view. Then open the Tree window, right-click on your desired folder and select New and then Trend from the dropdown menu.

My Dashboards menu to create a new Trend
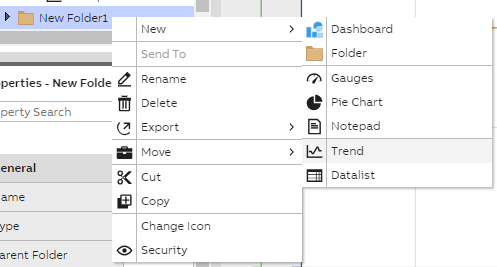
View menu to create a new trend
Either way, now you should have an empty Trend monitor and you can start adding your own data and modifying the appearance of data shown.
Generally, when working with unfinished trends or dashboards, avoid creating these in a folder where it is available to your end users in the production environment. If only you need to edit the trend or dashboard, it is safe to create it in the User's Definitions folder. It is private and only available to you.
The ready made trend has the following widgets as default setting:
- Chart ( where the data is shown)
- Rulers (give number scale(s) to the chart data. These appear on left and right side of chart when data is added)
- Time bar (to visualize the time period of the data shown on chart)
- Legend (will show further data information on table. Will appear below chart. Will update automatically when data is added to chart. We will discuss this in further detail below.)
- Single property editor on right upper corner (will show chart items automatically when data is added. Property definitions may be configured with this)
- Splitters
More information on the widgets can be found on the page Standard Widgets.
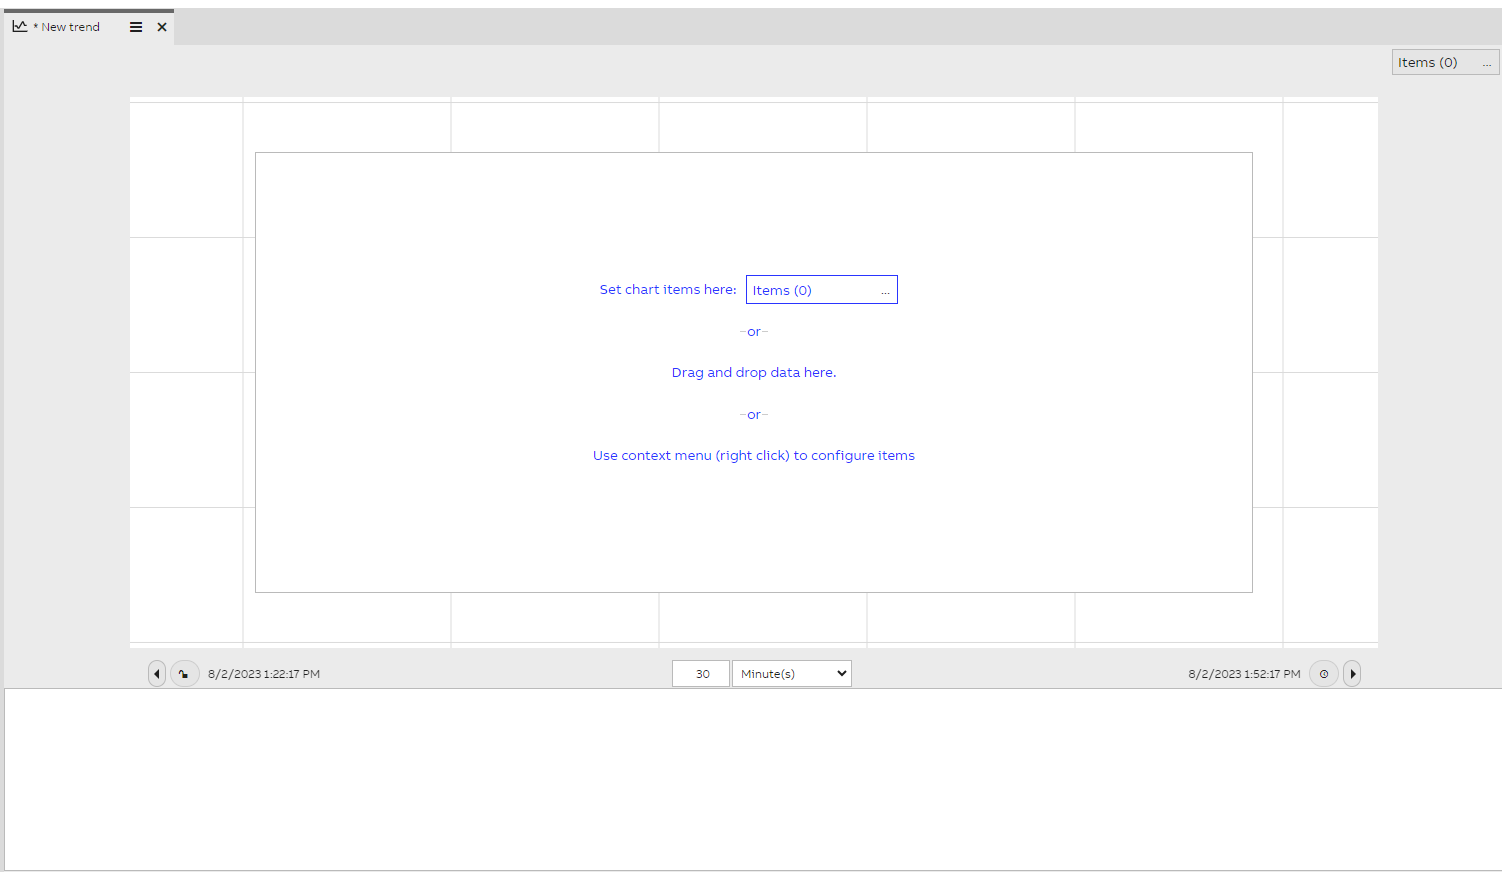
Example of new empty trend view
Data may be easily added to chart by simply choosing variables from variables menu or properties from equipment model menu and dragging and dropping these on the chart. After all the necessary data is added you can start enhancing the appearance as wished.
Data appearance modifications
Data presentation on chart may be modified by opening a menu from single property editor. The picture below shows the different settings for each chart item.

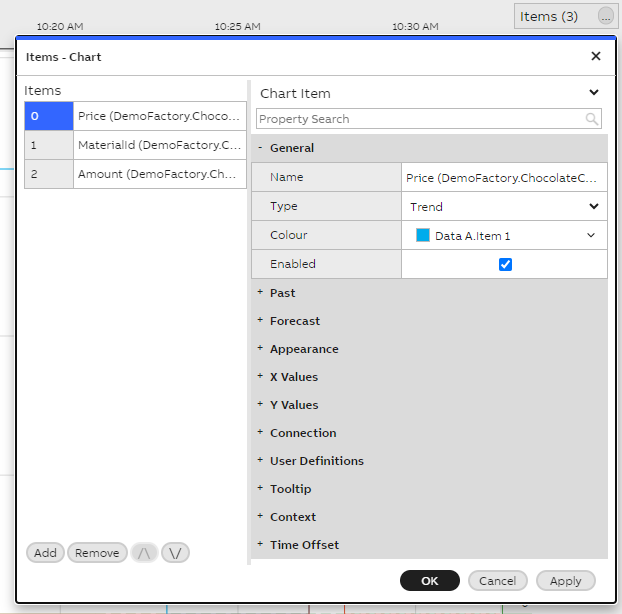
Example of single property items editor menu
When looking at the opened property menu, under Generaland Appearance options we can change data placements, colors, font sizes, borders and so on. On default, the numerical data is presented as type Trend but this may be easily changed from the General -> Type options. When using the default Trend type, you may also set a marker type for each chart item on the Legend below the chart. This highlights the time a value has changed.
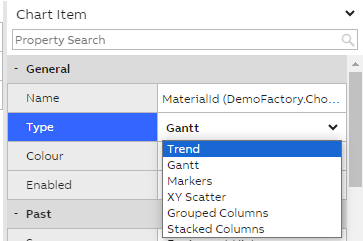
Single property editor Type menu
We kindly remind that the chart will only show numerical data. If you for example have an id number that is a combination of string + number value, this will not be visible on the trend on default. However, changing the Type to type Gantt will make it appear on the chart. As default, the size of the Gantt will cover the whole chart, but on the Appearance options giving the Height(%) a value will scale the Gantt. For example setting the Gantt as 10 % will show the value on top of the chart as visualized in the picture below.
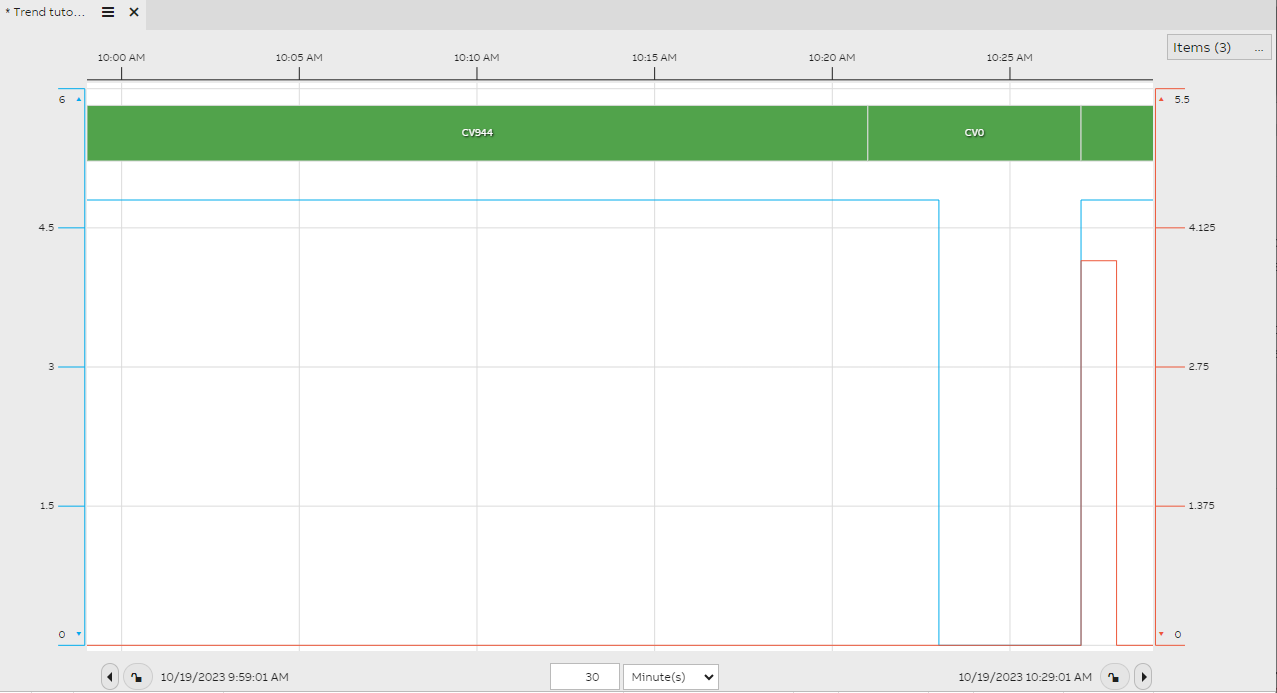
Example of Gantt type data on top of a trend chart
Legend
Legend appears under the chart after adding data. On default the legend shows following columns;
- Enabled
- Colour
- Name
- Process path
- Pointer value
- Unit (if set)
- Marker Type
- Delete
You may change this on editor mode and choosing Columns property on the legend menu. Here you can see what columns are enabled, what can be added and you can also modify the settings of each column, for example width and header text.
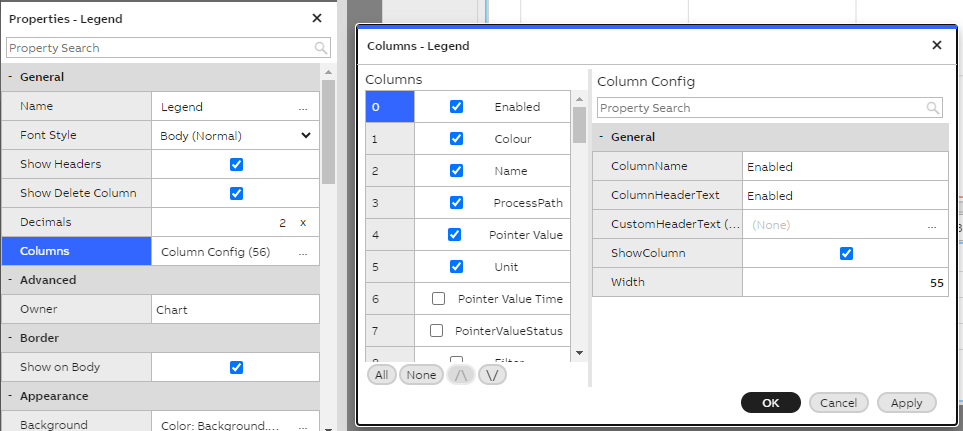
Legend properties Column menu
You may also modify other widgets and their appearance as when creating a new dashboard. Always remember to save changes before closing the window.
Filters to process data
Filtering is a mechanism to further process raw time series data. It is used by typing in the keywords defined in the filter syntax. By adding a filter property to legend we can modify the values shown per property. For example if we wanted to show average value per hour for only one property, we could add this as a filter and not having to change the time or other property values shown on chart.
Please find further information under using filters article and graph & filter examples under time series > aggregates and filters.
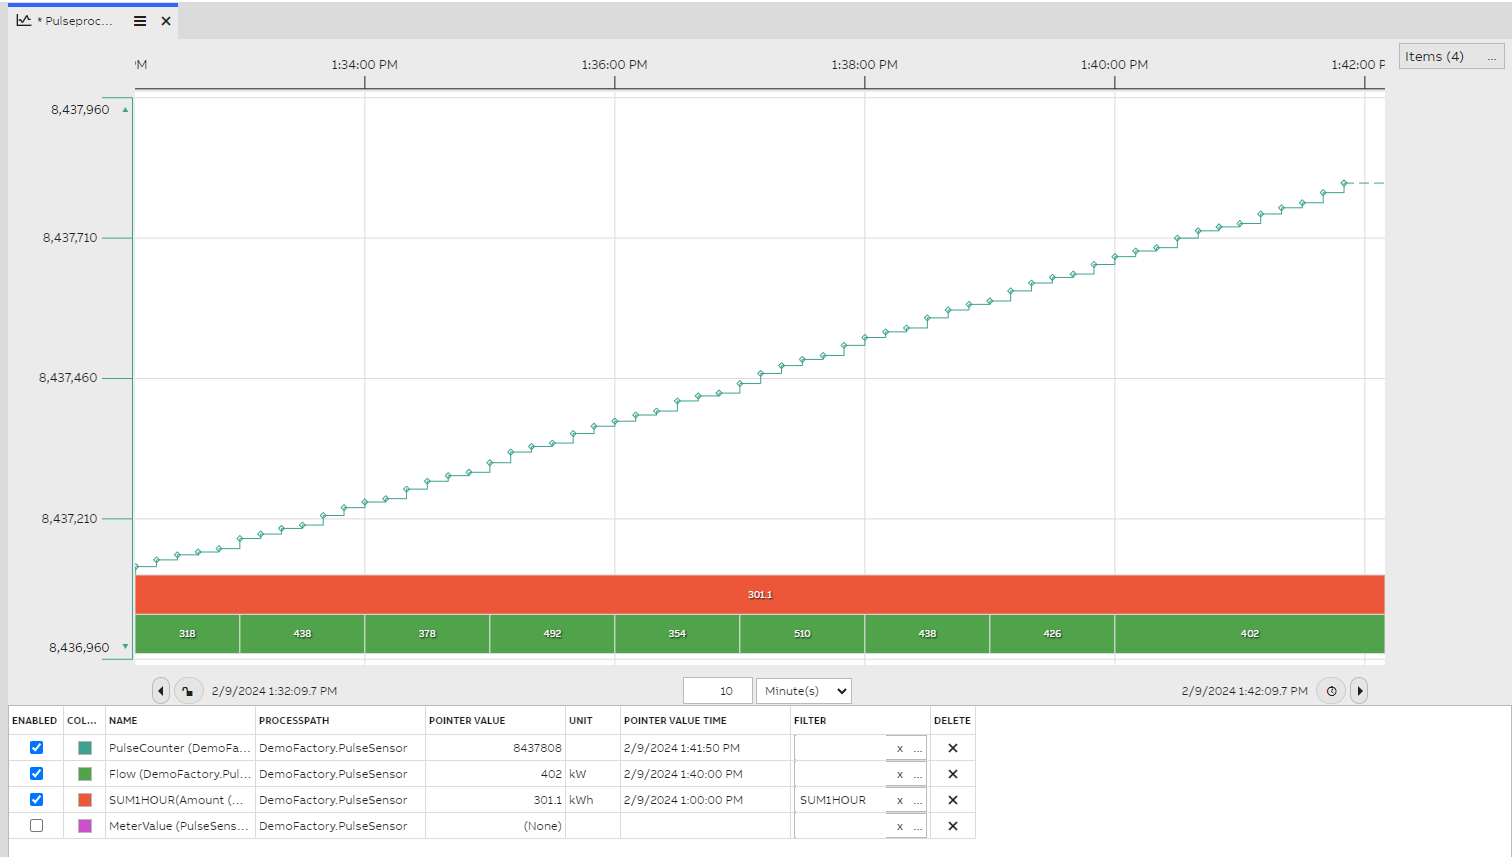
The Trend Legend shows example of SUM1HOUR filter used
Visualizing events with markers
It is possible to visualize events or other discrete values in the trend with markers.

The orange squares represent markers for the Alarm Log events.
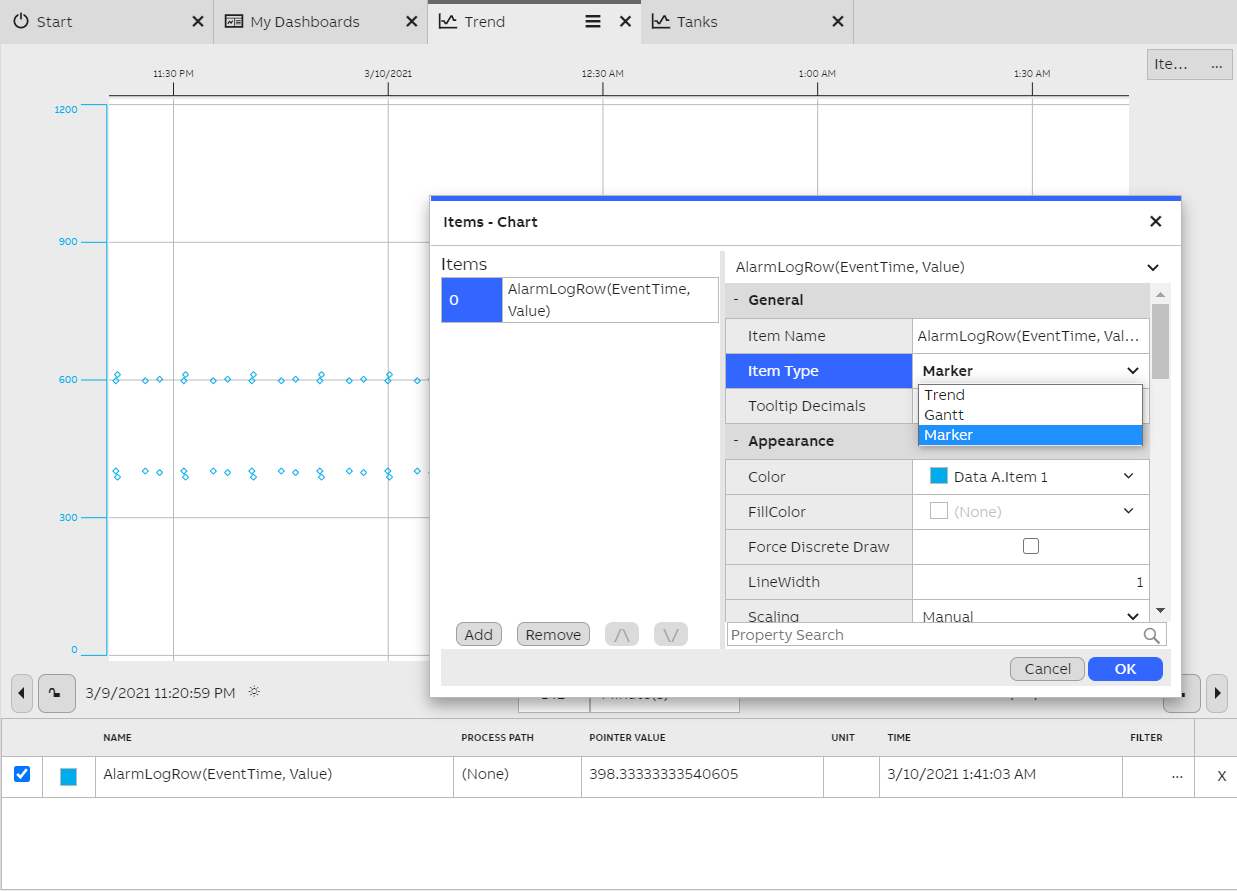
First, add event data onto the trend by creating a new item. This may be done on the single property editor menu. To display alarm log rows, change the source to "Alarm log row". Set the X Property as "Event Time" and Y Property to "Value". The markers are positioned on the trend according to these properties.
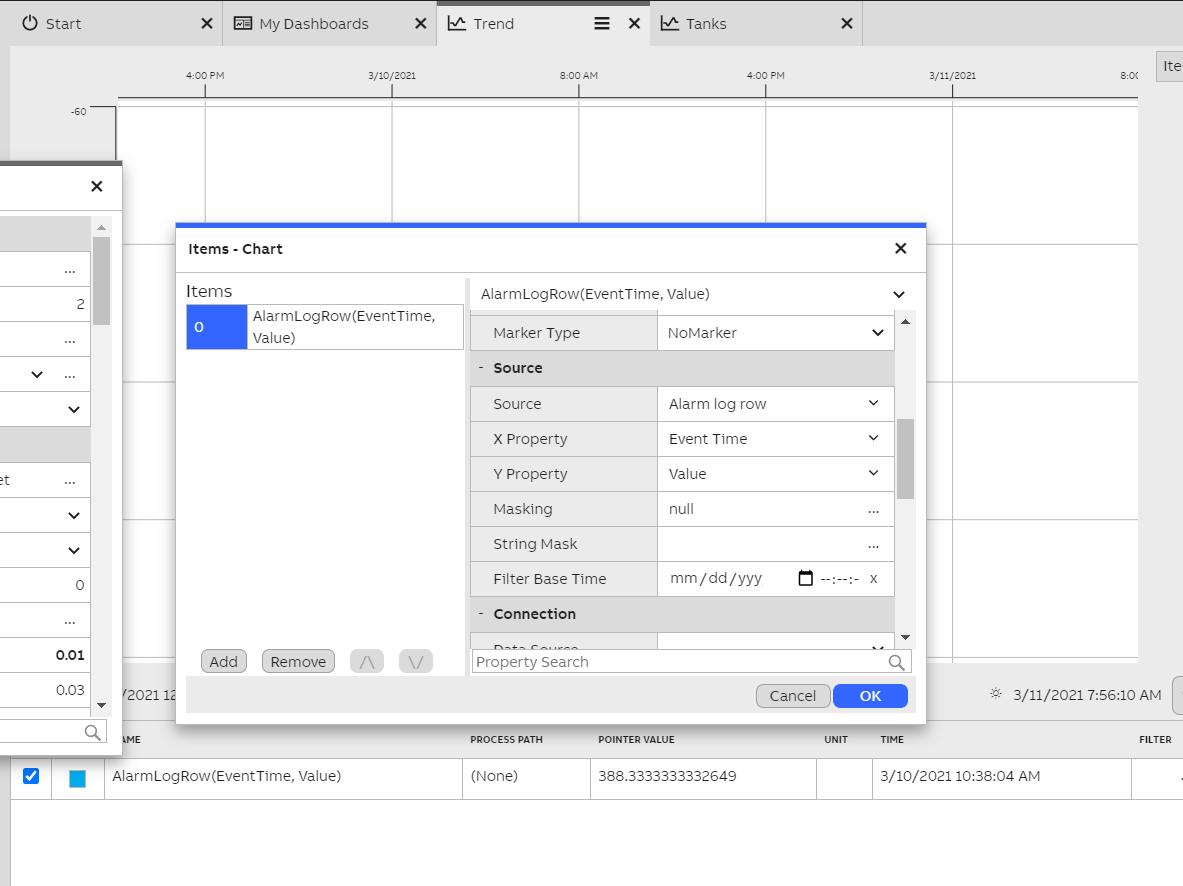
Now, change the item type to "Marker".
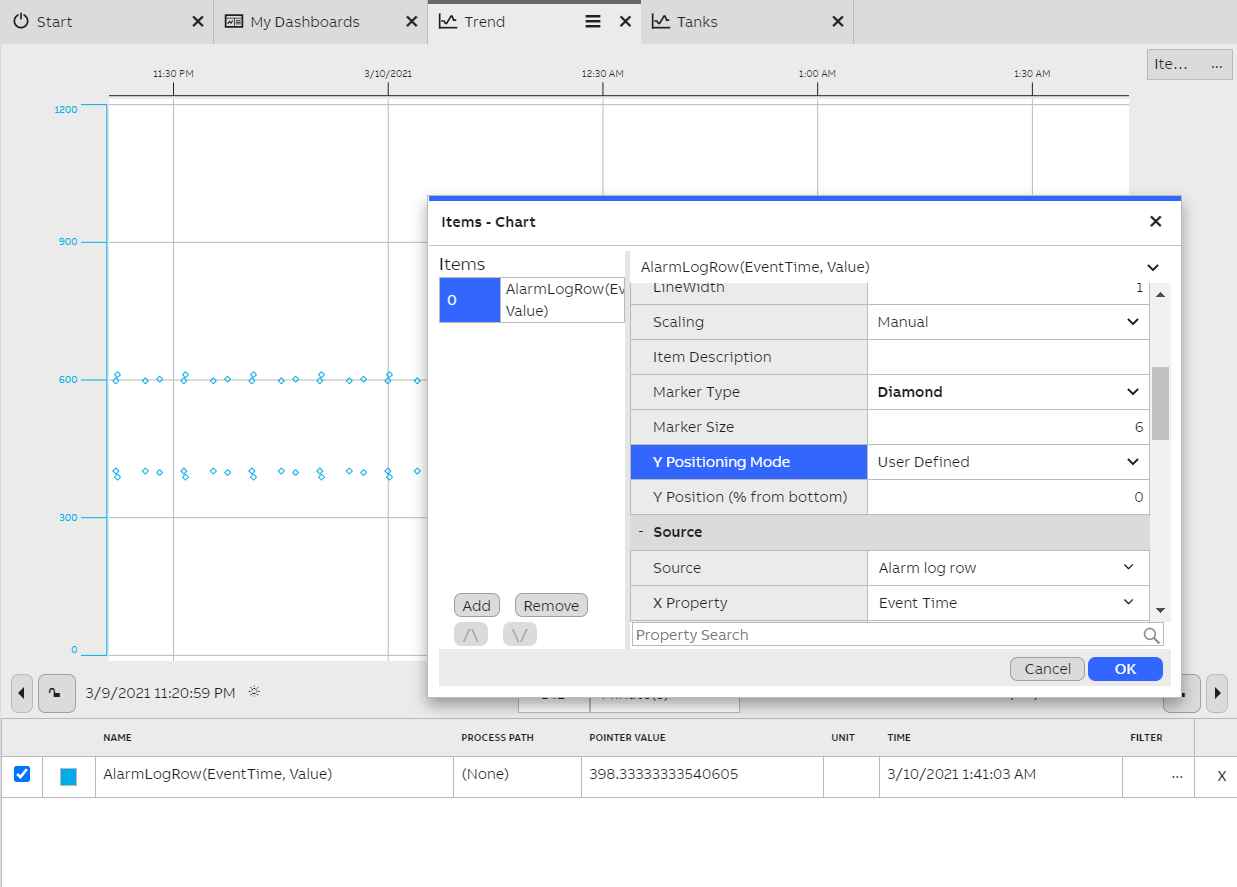
To finish configuring the event markers, change the Marker Type and Marker Size to define the shape and size of the markers. Use the Y Positioning Mode property to define how to display the markers:
- Automatic: The markers are positioned according to the value of the Y Property. If it is not a valid numerical value, the markers are automatically positioned so that multiple marker items do not overlap.
- User Defined: The markers are positioned along a straight line. The Y position can be adjusted with the Y Position property, where the value is a percentage of the trend viewport from the bottom.
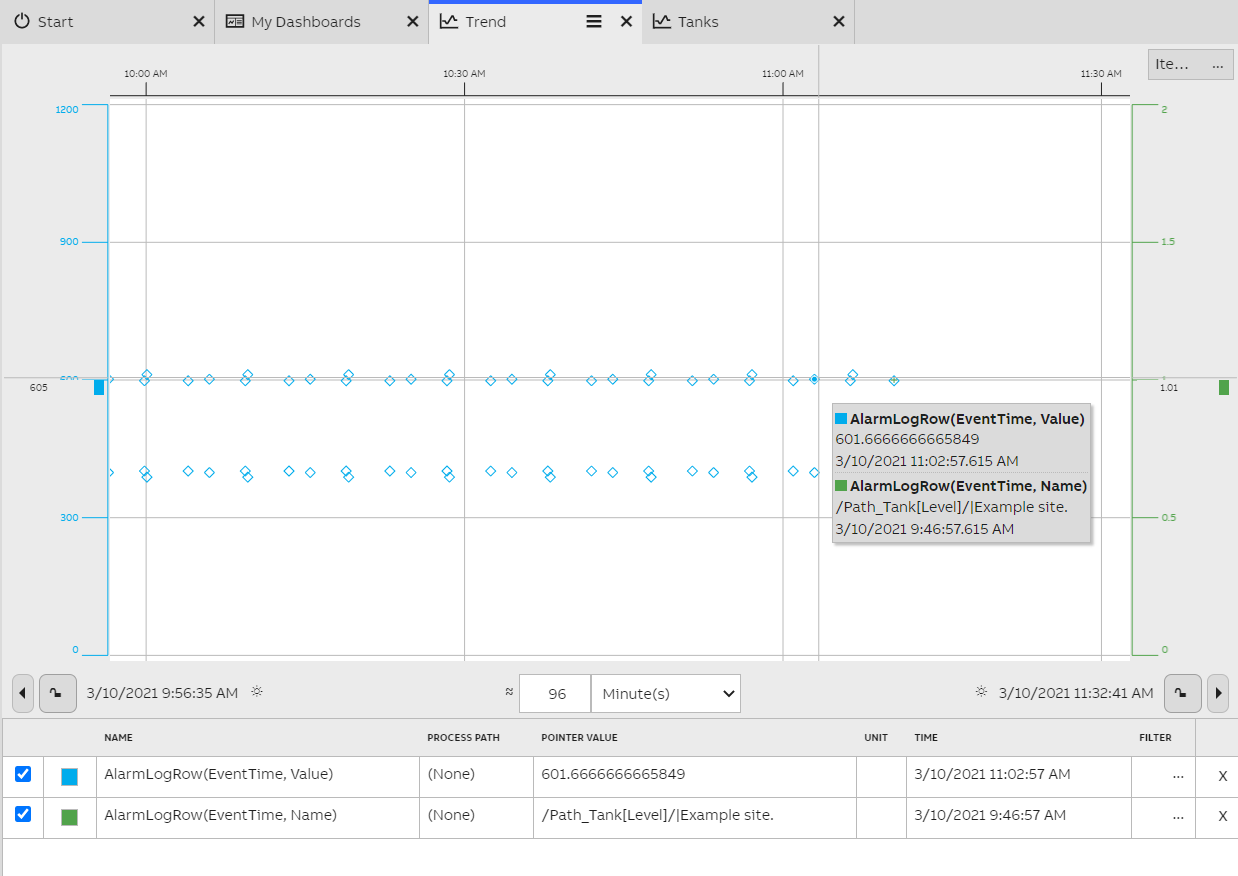
Now the event markers are configured. You can see a single marker's precise value from the tooltip.
Further reading
- For overview information on creating a dashboard with widgets and correct scaling possibilities, please see Dashboard editor article.
- For a detailed guide for creating a custom made dashboard, please see Dashboard step-by-step tutorial
Updated 6 months ago